
Collect traces, metrics, and logs with OpenTelemetry
For the complete documentation index, see llms.txt. For a full content snapshot, see llms-full.txt. Append.mdto anykestra.io/docs/*URL for plain Markdown.
Observability refers to understanding a system’s internal state by analyzing its outputs. In software, this means examining telemetry data — such as traces, metrics, and logs — to gain insights into system behavior.
OpenTelemetry is a vendor-neutral, tool-agnostic framework and toolkit for creating and managing telemetry data. It helps implement observability in software applications.
OpenTelemetry defines three different kinds of telemetry data:
- Traces provide a high-level view of what happens when a request is made to an application. A trace can contain multiple spans.
- Metrics are measurements of a service captured at runtime.
- Logs are timestamped text records, either structured (recommended) or unstructured, with optional metadata.
Kestra supports all three kinds of telemetry data via OpenTelemetry-compatible exporters. For more details, see the OpenTelemetry official documentation.
Traces
The first step is to enable distributed traces inside the Observability and Networking configuration file:
micronaut: otel: enabled: truekestra: traces: root: DEFAULT # Enable traces inside Kestra flow executionsotel: traces: exporter: otlp # Only otlp is supported for now exporter: otlp: endpoint: http://localhost:4317 # Replace with the address of your own collectorWhen enabled, Kestra instruments:
- All calls to its API
- All flow executions (one span per task execution, plus one span for each execution message processed by the Executor)
- External HTTP calls made by the HTTP tasks (including tasks that use the Kestra HTTP client)
Trace correlation
Kestra propagates the trace context so that traces are correlated:
- The API call trace correlates with the execution it creates.
- Flow execution traces correlate with parent flows when the
SubfloworLooptask is used. - External HTTP calls include the standard propagation header for downstream correlation.
Propagate trace context to scripts
Scripts run in isolated containers, so OTel spans they generate start a new root trace by default. Pass {{ trace.parent }} as the TRACEPARENT environment variable to parent those spans under the Kestra task span.
{{ trace.parent }} holds the W3C traceparent header; it is empty when tracing is disabled.
id: traced_scriptnamespace: company.team
tasks:  - id: run_python    type: io.kestra.plugin.scripts.python.Script    env:      TRACEPARENT: "{{ trace.parent }}"    script: |      from opentelemetry.propagate import extract      from opentelemetry.sdk.trace import TracerProvider      import os
      ctx = extract({"traceparent": os.environ.get("TRACEPARENT", "")})      tracer = TracerProvider().get_tracer(__name__)
      with tracer.start_as_current_span("my-span", context=ctx):          pass  # spans here appear as children of the Kestra task span
TRACEPARENT is recognized by all major OTel SDKs and works the same way for Node.js, Bash, and any other script type. The variable is also usable in HTTP task headers and any other expression-capable property.
Example: Jaeger with Docker Compose
Enable Jaeger, an OpenTelemetry-compatible tracing platform, with Kestra in a Docker Compose configuration file:
services:  # Postgres is included here as a dependency for Kestra during local testing  postgres:    image: postgres:14.13    environment:      POSTGRES_DB: kestra_unit      POSTGRES_USER: kestra      POSTGRES_PASSWORD: k3str4    ports:      - 5432:5432    restart: on-failure
  jaeger-all-in-one:    image: jaegertracing/all-in-one:latest    ports:      - "16686:16686"  # Jaeger UI      - "14268:14268"  # OpenTracing (optional)      - "4317:4317"    # OTLP gRPC receiver      - "4318:4318"    # OTLP HTTP receiver      - "14250:14250"  # External otel-collector (optional)    environment:      - COLLECTOR_OTLP_ENABLED=true    restart: on-failure
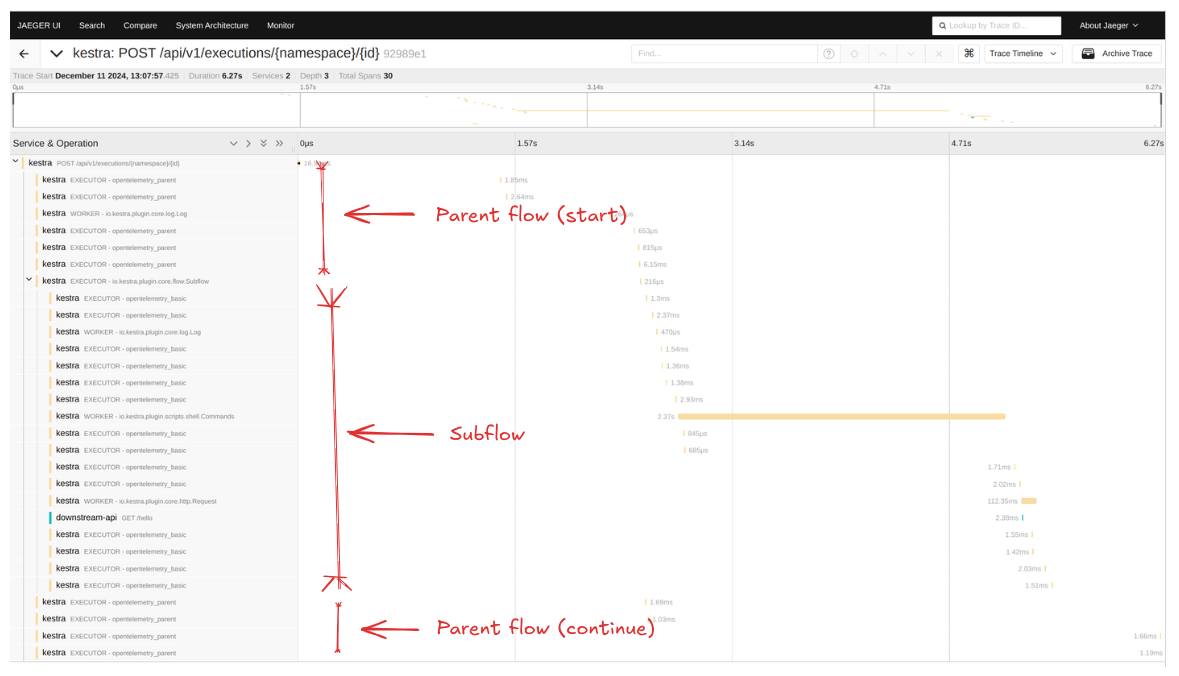
The following screenshot shows three correlated traces:
- One created from the API call that creates the execution
- One created from an execution of a flow named
opentelemetry_parentwhich has spans for tasks including aSubflow - One created from the
opentelemetry_basicflow execution
Disabling traces
You can disable traces for flows while keeping API traces:
kestra: traces: root: DISABLEDYou can also disable traces per component (experimental). For example, disabling only Executor spans:
kestra: traces: root: DEFAULT categories: io.kestra.core.runners.Executor: DISABLEDSupported categories
| Category | Description |
|---|---|
io.kestra.core.runners.Executor | Spans for each message in the execution queue |
io.kestra.core.runners.Worker | Spans for each runnable task execution |
io.kestra.plugin.core.flow.Subflow | Spans for each Subflow task execution |
io.kestra.plugin.core.flow.Loop | Spans for each Loop sub-execution |
Metrics
To send metrics to an OpenTelemetry-compatible collector, add the following parameters to your Observability and Networking configuration file:
micronaut: metrics: export: otlp: enabled: true url: http://localhost:4318/v1/metrics # Replace with your collector URLFor example, you can configure an OpenTelemetry Collector to forward metrics to Prometheus:
receivers:  otlp:    protocols:      http:        endpoint: 0.0.0.0:4318
exporters:  prometheus:    endpoint: "0.0.0.0:9464"
Logs
To send logs to an OpenTelemetry-compatible collector, use the LogShipper with the built-in OpenTelemetry log exporter.
LogShipper is only available in the Kestra Enterprise Edition.
The following flow sends logs from all flows to a collector daily:
id: log_shippernamespace: company.team
triggers:  - id: daily    type: io.kestra.plugin.core.trigger.Schedule    cron: "@daily"
tasks: - id: log_export type: io.kestra.plugin.ee.core.log.LogShipper logExporters: - id: OTLPLogExporter type: io.kestra.plugin.ee.opentelemetry.LogExporter otlpEndpoint: http://localhost:4318/v1/logs # Replace with your collector URLWas this page helpful?