
Navigate the Kestra UI: Flows, No Code Editor, Executions & Admin
For the complete documentation index, see llms.txt. For a full content snapshot, see llms-full.txt. Append.mdto anykestra.io/docs/*URL for plain Markdown.
Kestra’s web UI is available by default on port 8080.
When you first open the UI, a Welcome to Kestra tour popup appears on the AI Copilot page.
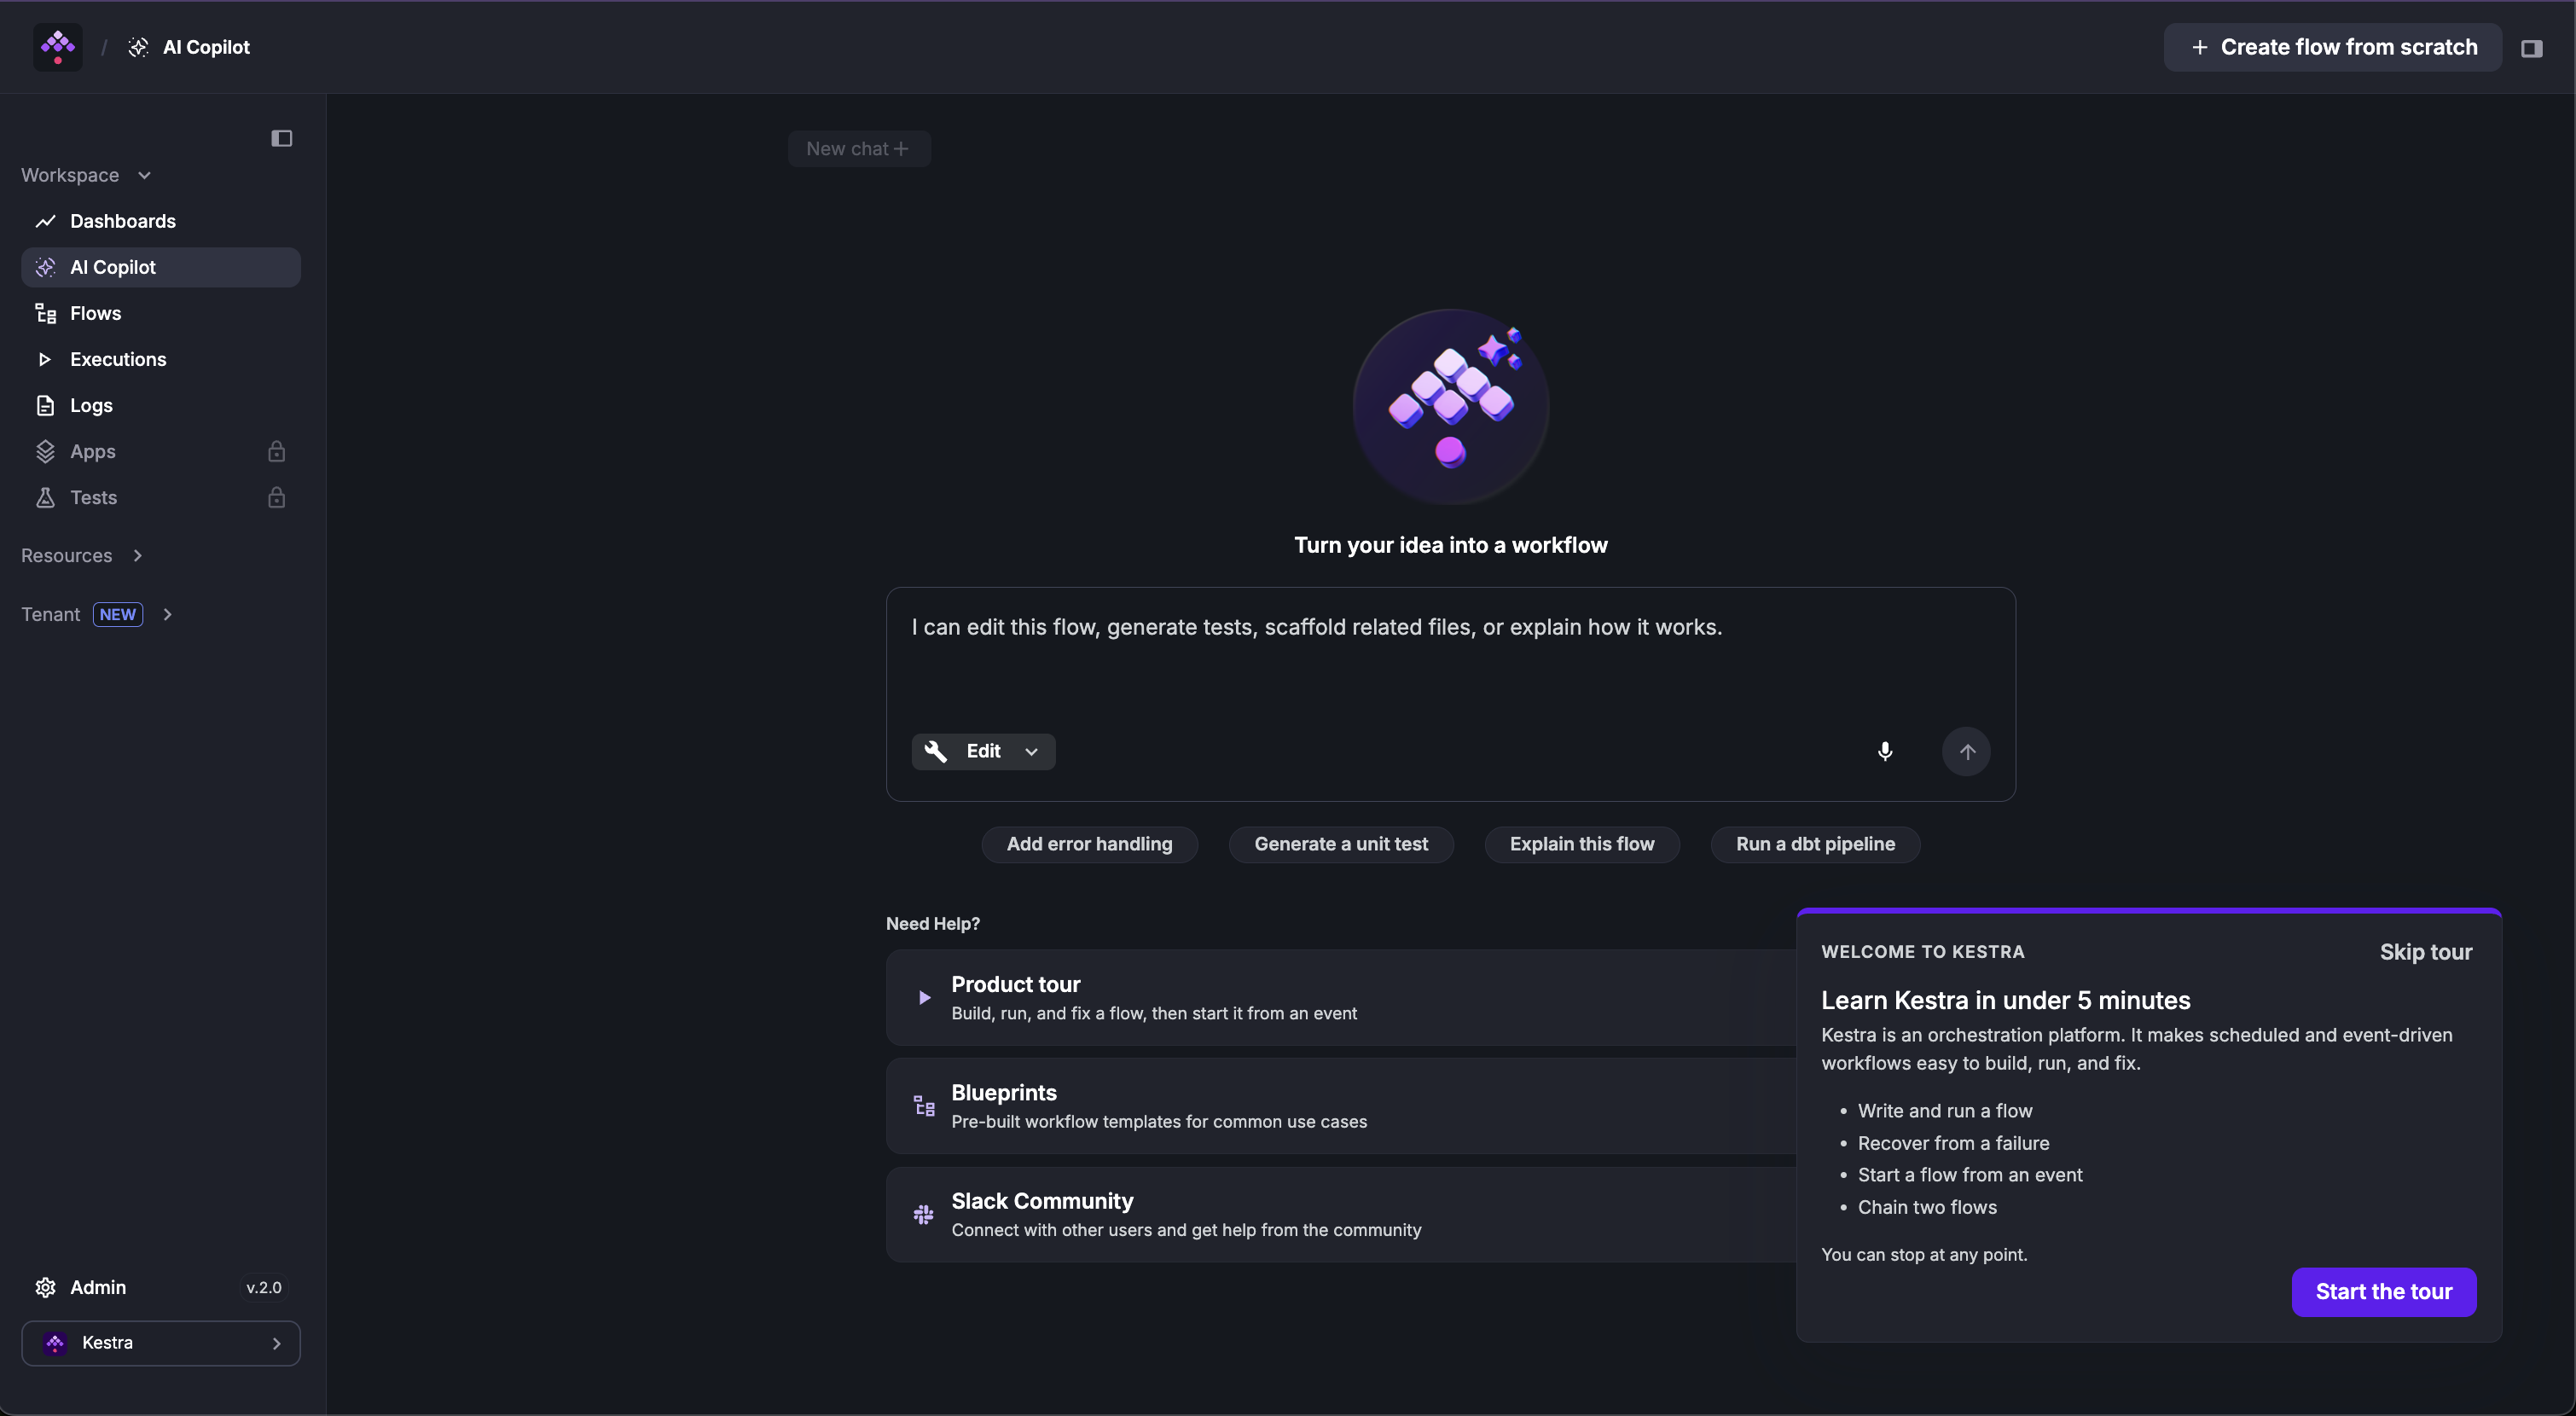
Click Start the tour to walk through creating and executing your first flow.
The UI includes a No Code editor for building flows and dashboards visually without writing YAML — available from the Flows and Dashboard pages.
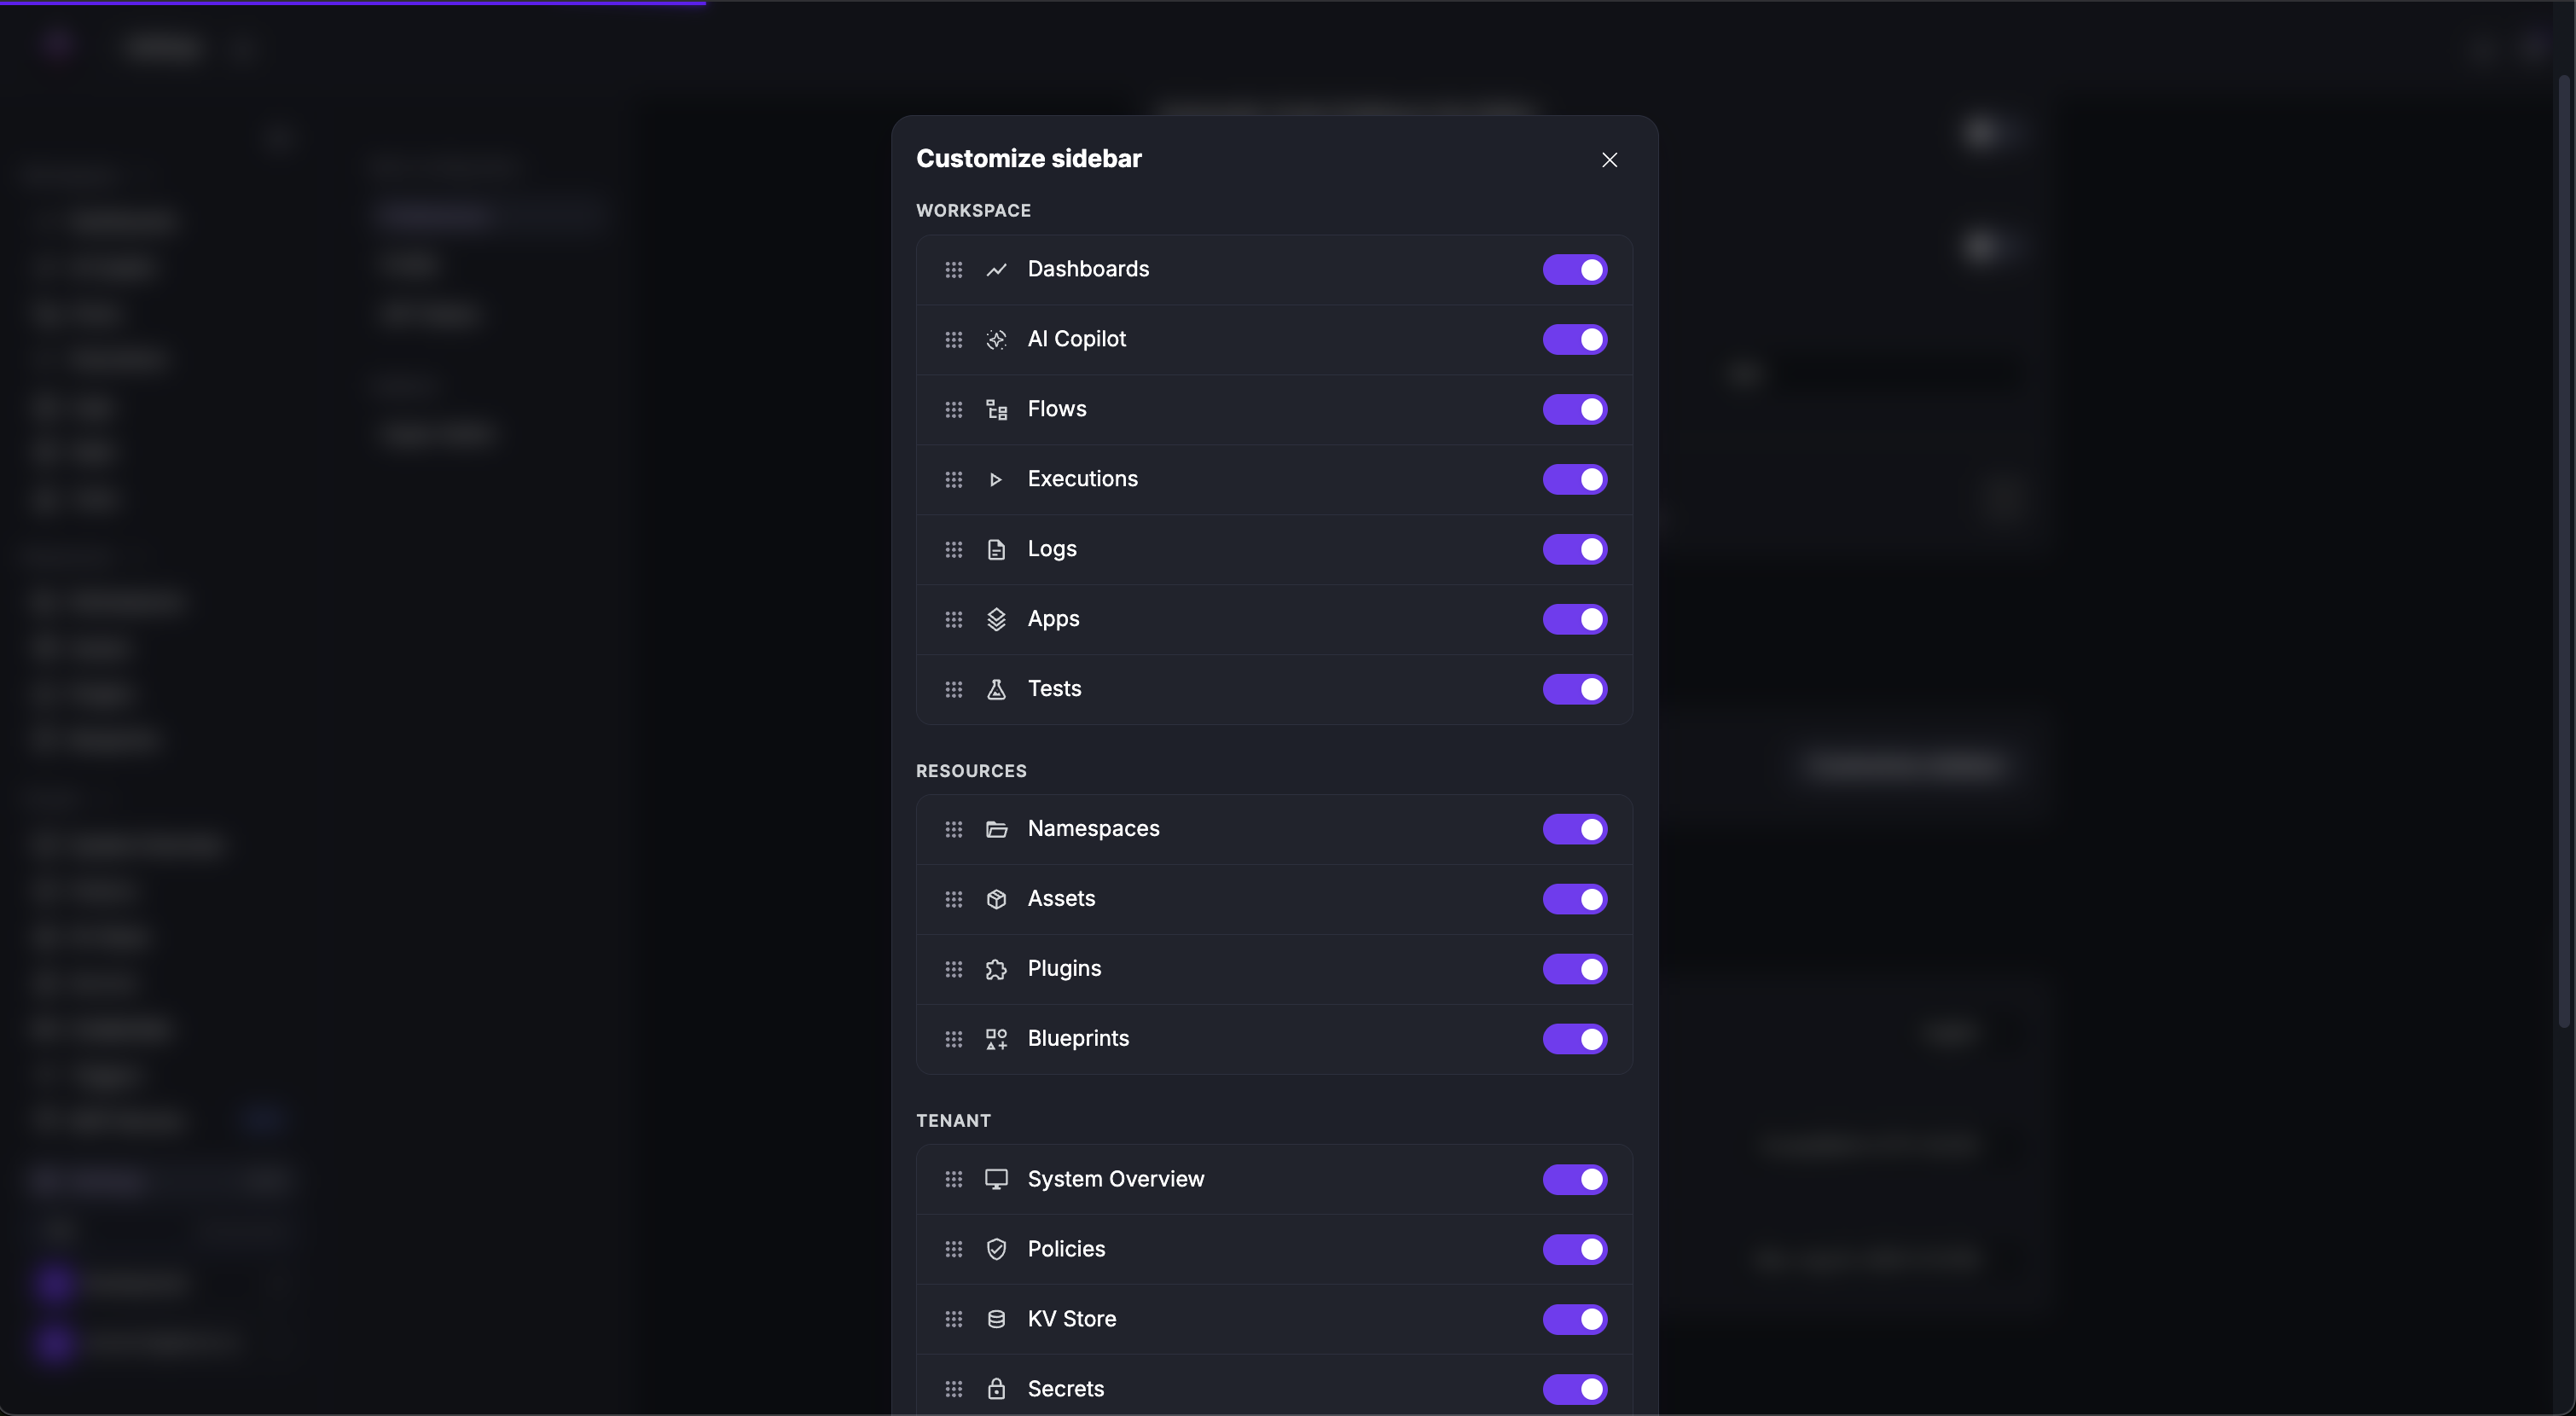
The left sidebar is organized into three sections:
Workspace — day-to-day work:
- Dashboards — visualizations of flow execution data and metrics.
- AI Copilot — generate and edit flows from a plain-language description.
- Flows — browse, create, edit, and execute flows.
- Executions — inspect and manage previous executions.
- Logs — task logs from previous executions.
Resources — reusable assets and plugins:
- Namespaces — namespace-level configuration, files, secrets, and variables.
- Plugins — catalog of plugins available in your flows.
- Blueprints — ready-to-use flow examples.
Tenant — instance-level configuration:
- System Overview — instance health and usage metrics.
- KV Store — key-value pairs available across flows.
- Triggers — all active triggers across the tenant.
- MCP Servers — registered Model Context Protocol servers.
Kestra Enterprise Edition adds the following to the UI:
- Apps (Workspace) — list and create Apps that expose flows as user-facing forms.
- Tests (Workspace) — run flow unit tests and view assertions without creating executions.
- Assets (Resources) — manage reusable assets available to flows and apps.
- The Tenant section gains: Policies, Secrets, Credentials, Audit Logs, and IAM.
- Instance Owner (sidebar footer, visible to Instance Owner users only) — instance-wide administration covering services, tenants, Worker Groups, Worker Queues, Kill Switch, Announcements, Versioned Plugins, and instance-level IAM.
The sidebar is customizable. Go to Settings → Preferences → Customize Sidebar to reorder items or hide the ones you don’t need.
Dashboards
Monitor workflows with Kestra Dashboards. Visualize execution metrics, create custom charts, and track performance indicators in the UI.
Flows
Manage flows in the Kestra UI. Browse, edit, and execute workflows using the code editor, topology view, and version history tools.
Executions
Inspect flow runs in the Kestra UI. Track execution status, view logs, analyze outputs, and manage tasks via Gantt and Topology views.
Namespaces
Overview of the Namespaces UI in Kestra. Manage flows, files, KV store, and dependencies specific to each Namespace in a central view.
Settings
Customize the Kestra UI. Configure themes, editor preferences, time zones, and default settings to personalize your user experience.
Playground
Experiment in the Kestra Playground. Build and test tasks iteratively in the UI to debug and refine workflows without full execution.
Was this page helpful?