
Track, Inspect & Manage Flow Runs via Gantt and Topology Views
For the complete documentation index, see llms.txt. For a full content snapshot, see llms-full.txt. Append.mdto anykestra.io/docs/*URL for plain Markdown.
Inspect and manage flow executions.
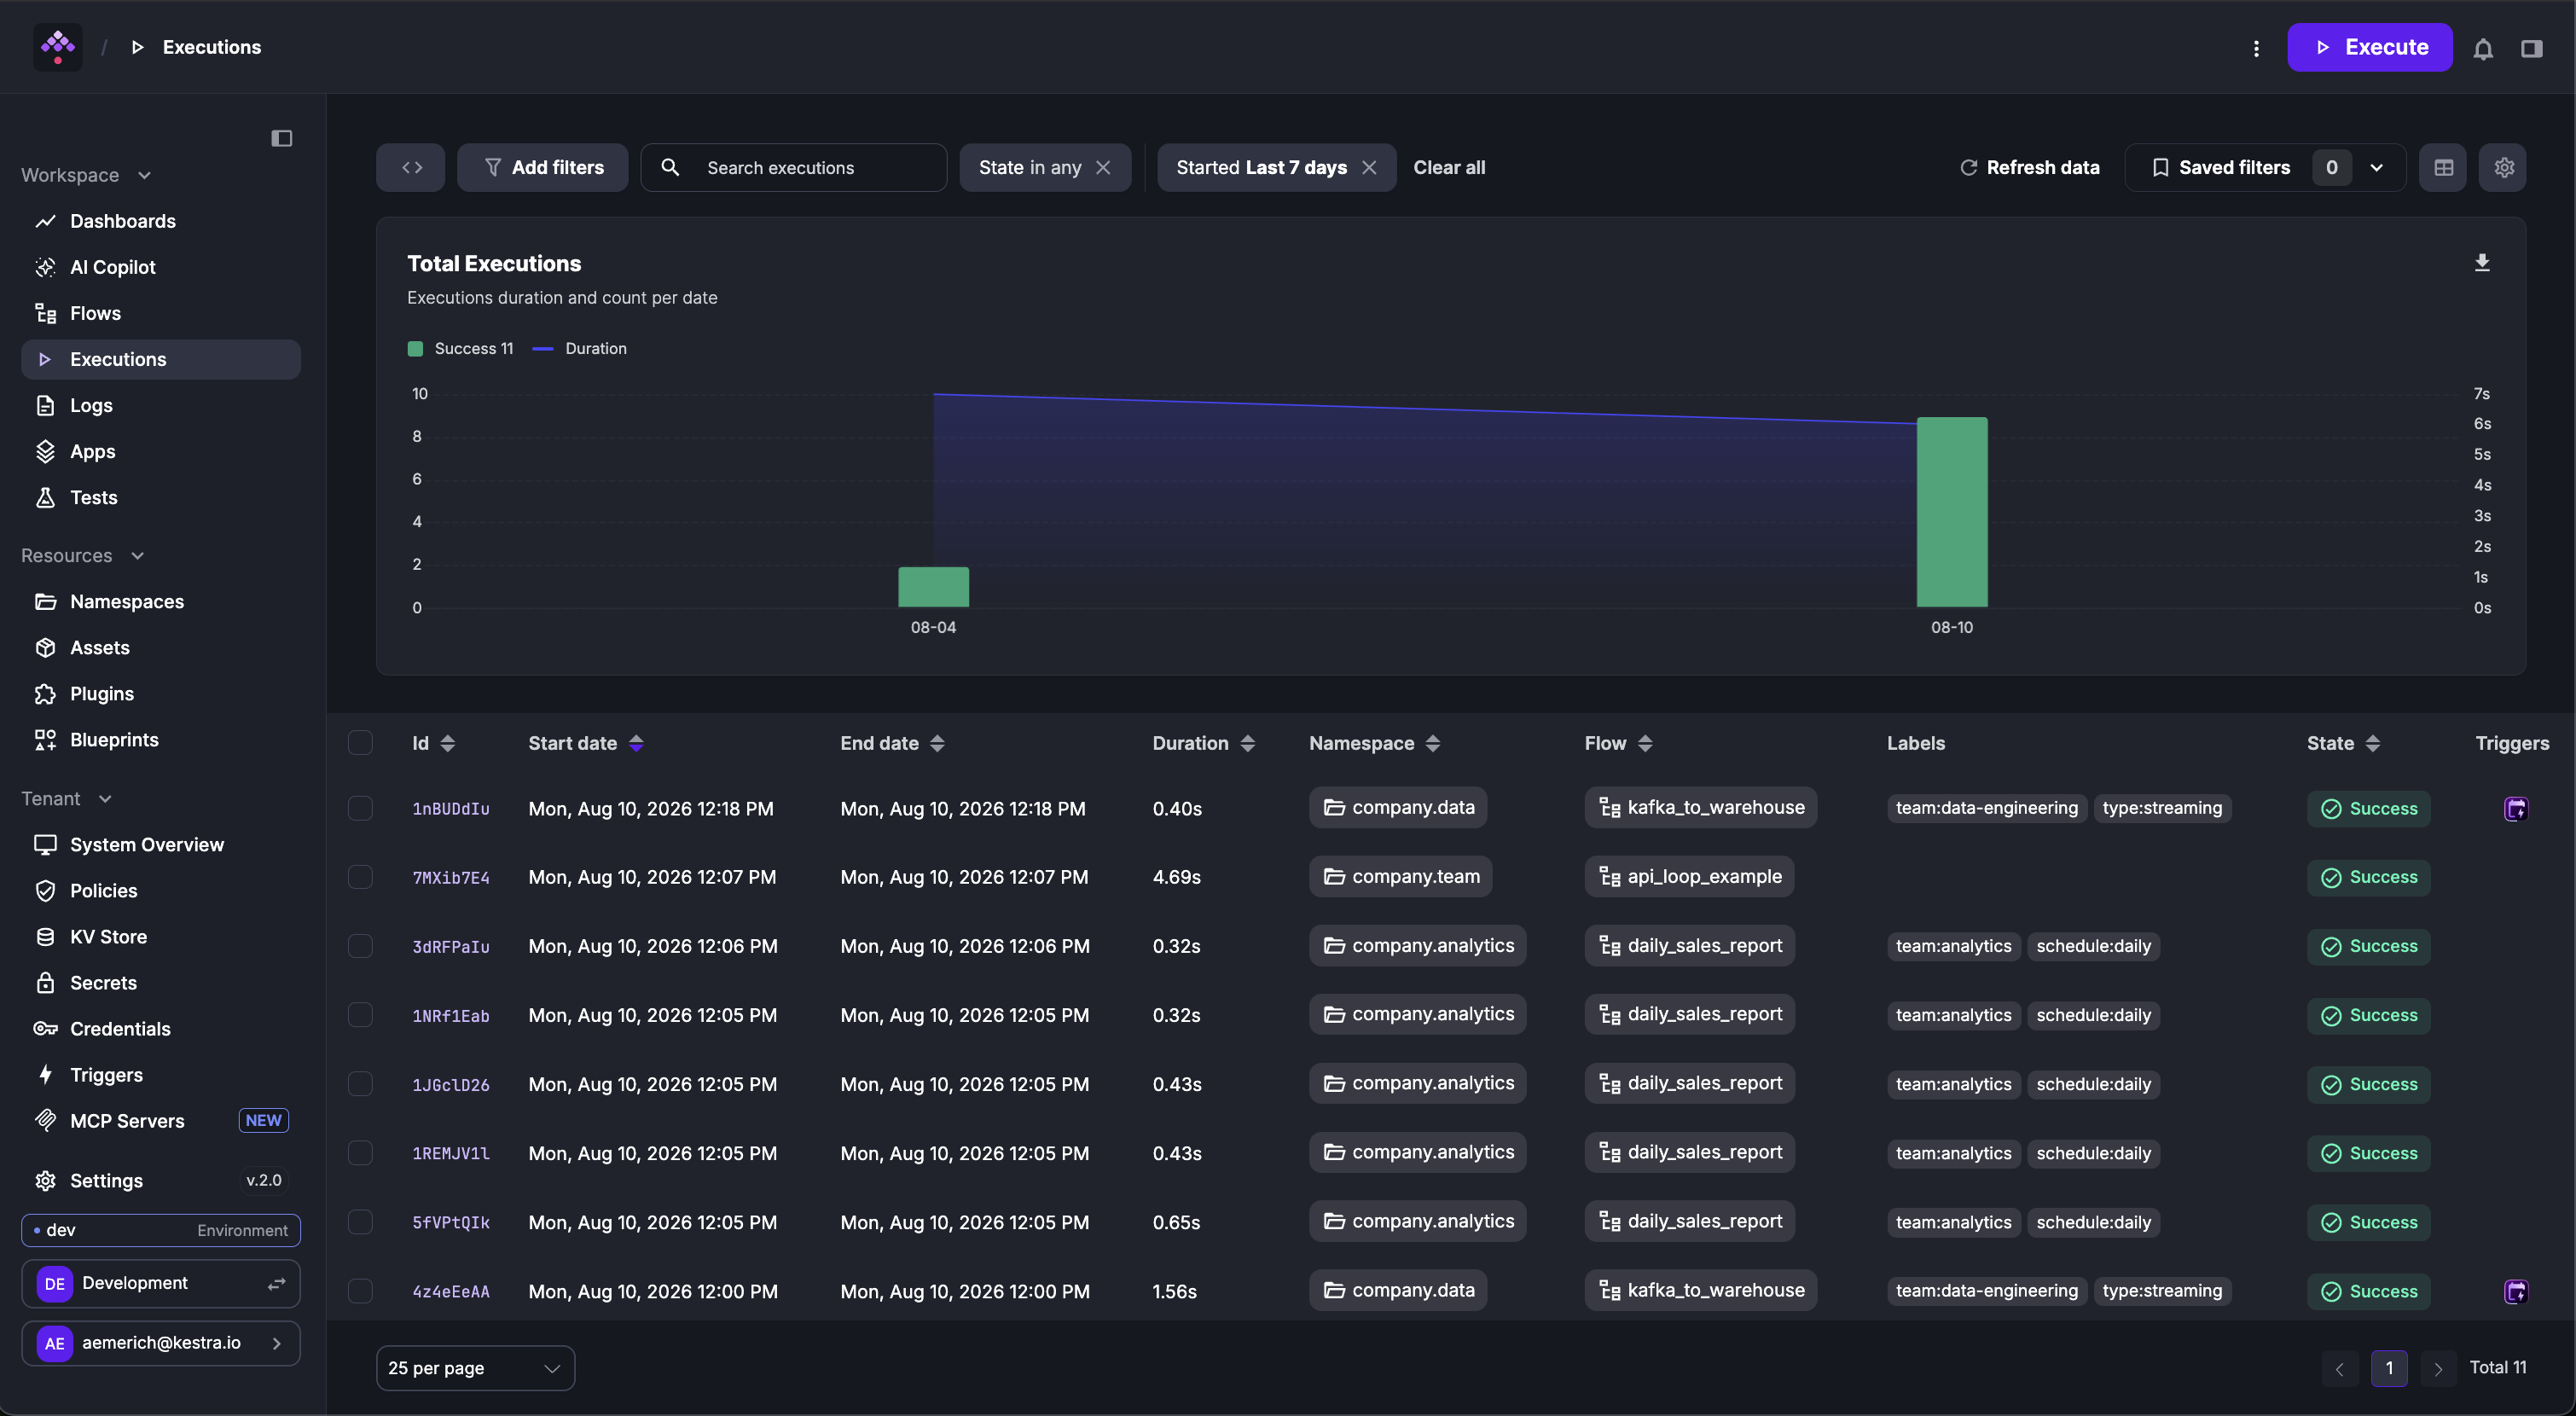
The Executions page lists all flow executions. Select one or more to perform bulk actions (Restart, Kill, Pause, Force Run), or click an execution ID to open it.
Overview
The Overview tab displays the details of a flow execution.
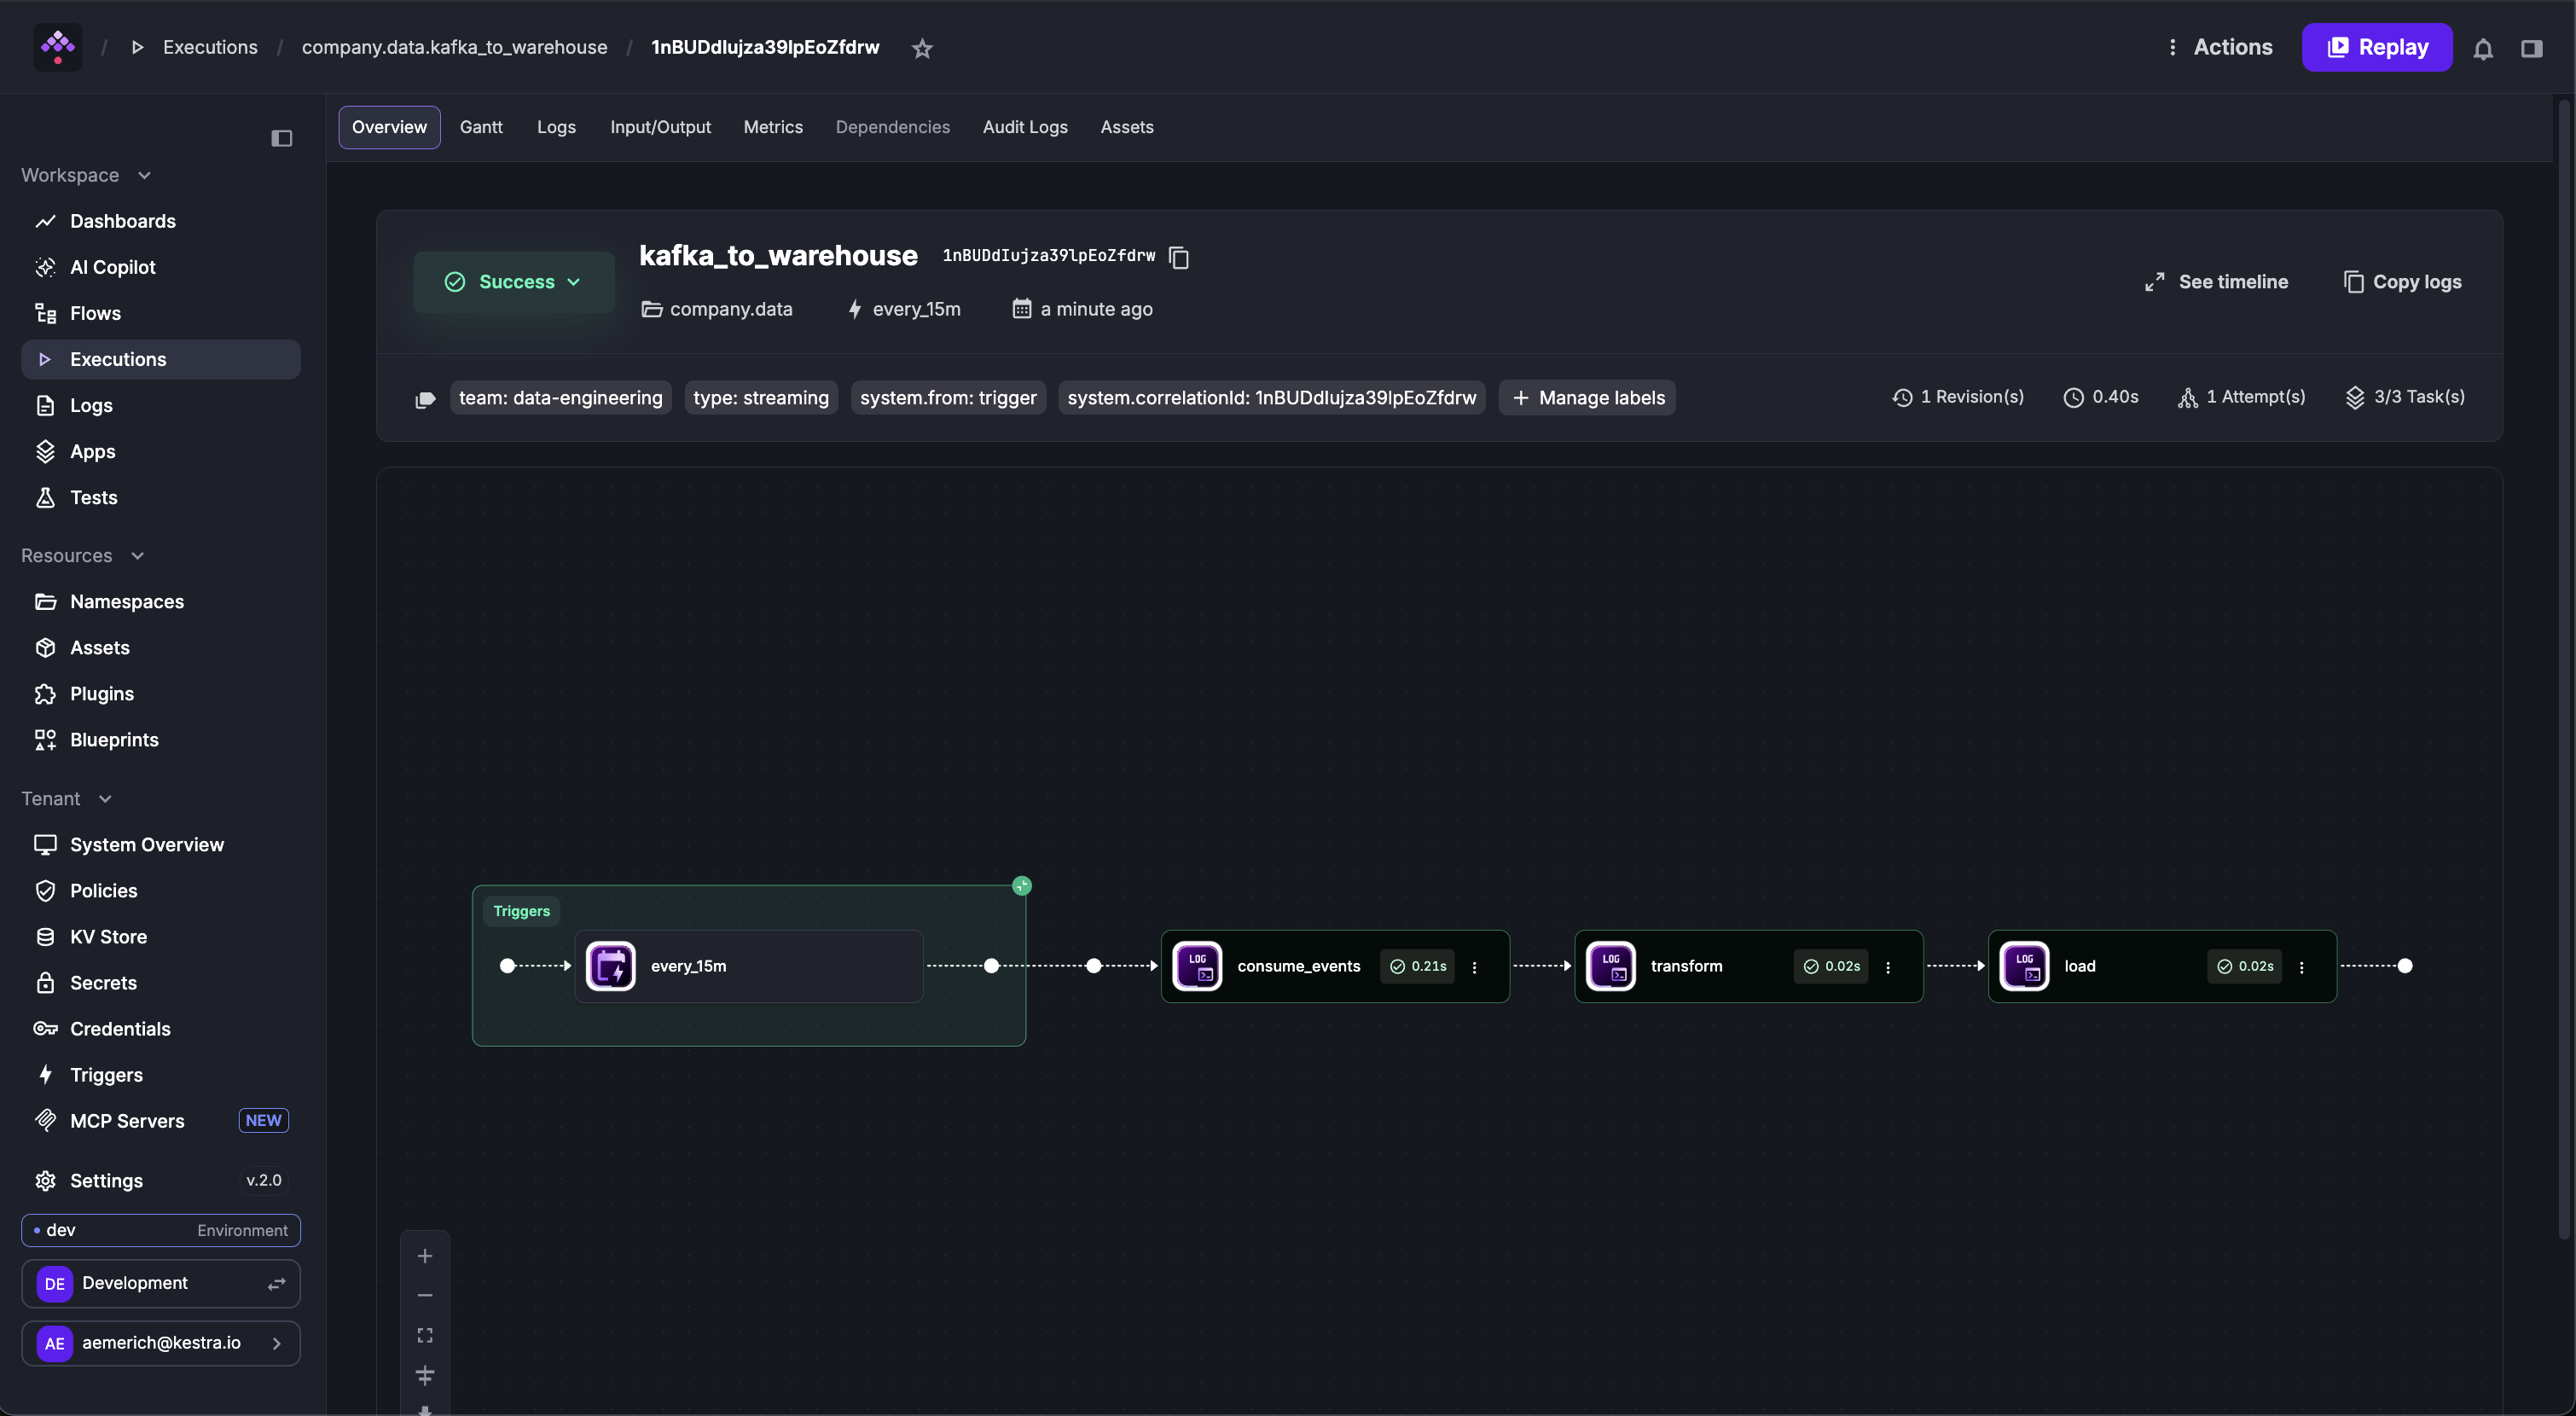
From the Overview tab, you can:
- Set Labels — add a label to the execution for tracking or filtering.
- Change State — manually update the execution state.
- Force Run — force the execution to run; may create duplicate task executions, so use with caution.
The Previous and Next Execution buttons step through past and scheduled future executions.
- Execution state is displayed along with a timestamped state history from
CREATEDtoRUNNINGtoSUCCESS(or any other possible state). - Flow Variables and Inputs are clearly listed along with execution details including dates and the corresponding namespace and flow.
- Flow outputs and trigger data are captured with expression rendering.
From the Overview tab, you can also take actions such as Replay or Pause, and view executions over time to compare previous runs.
The Overview tab also embeds a topology diagram showing each task’s state in the execution graph — green for SUCCESS, red for FAILED. Click any task node to access its logs, replay it, or change its status.
Filters
Filter executions by namespace, flow ID, labels, state, start date, or free text. Save applied filters or export results. The following video demonstrates the filters in action:
Gantt
The Gantt tab visualizes each task’s duration. From this interface, you can replay a specific task, see task source code, change task status, or look at task metrics and outputs.
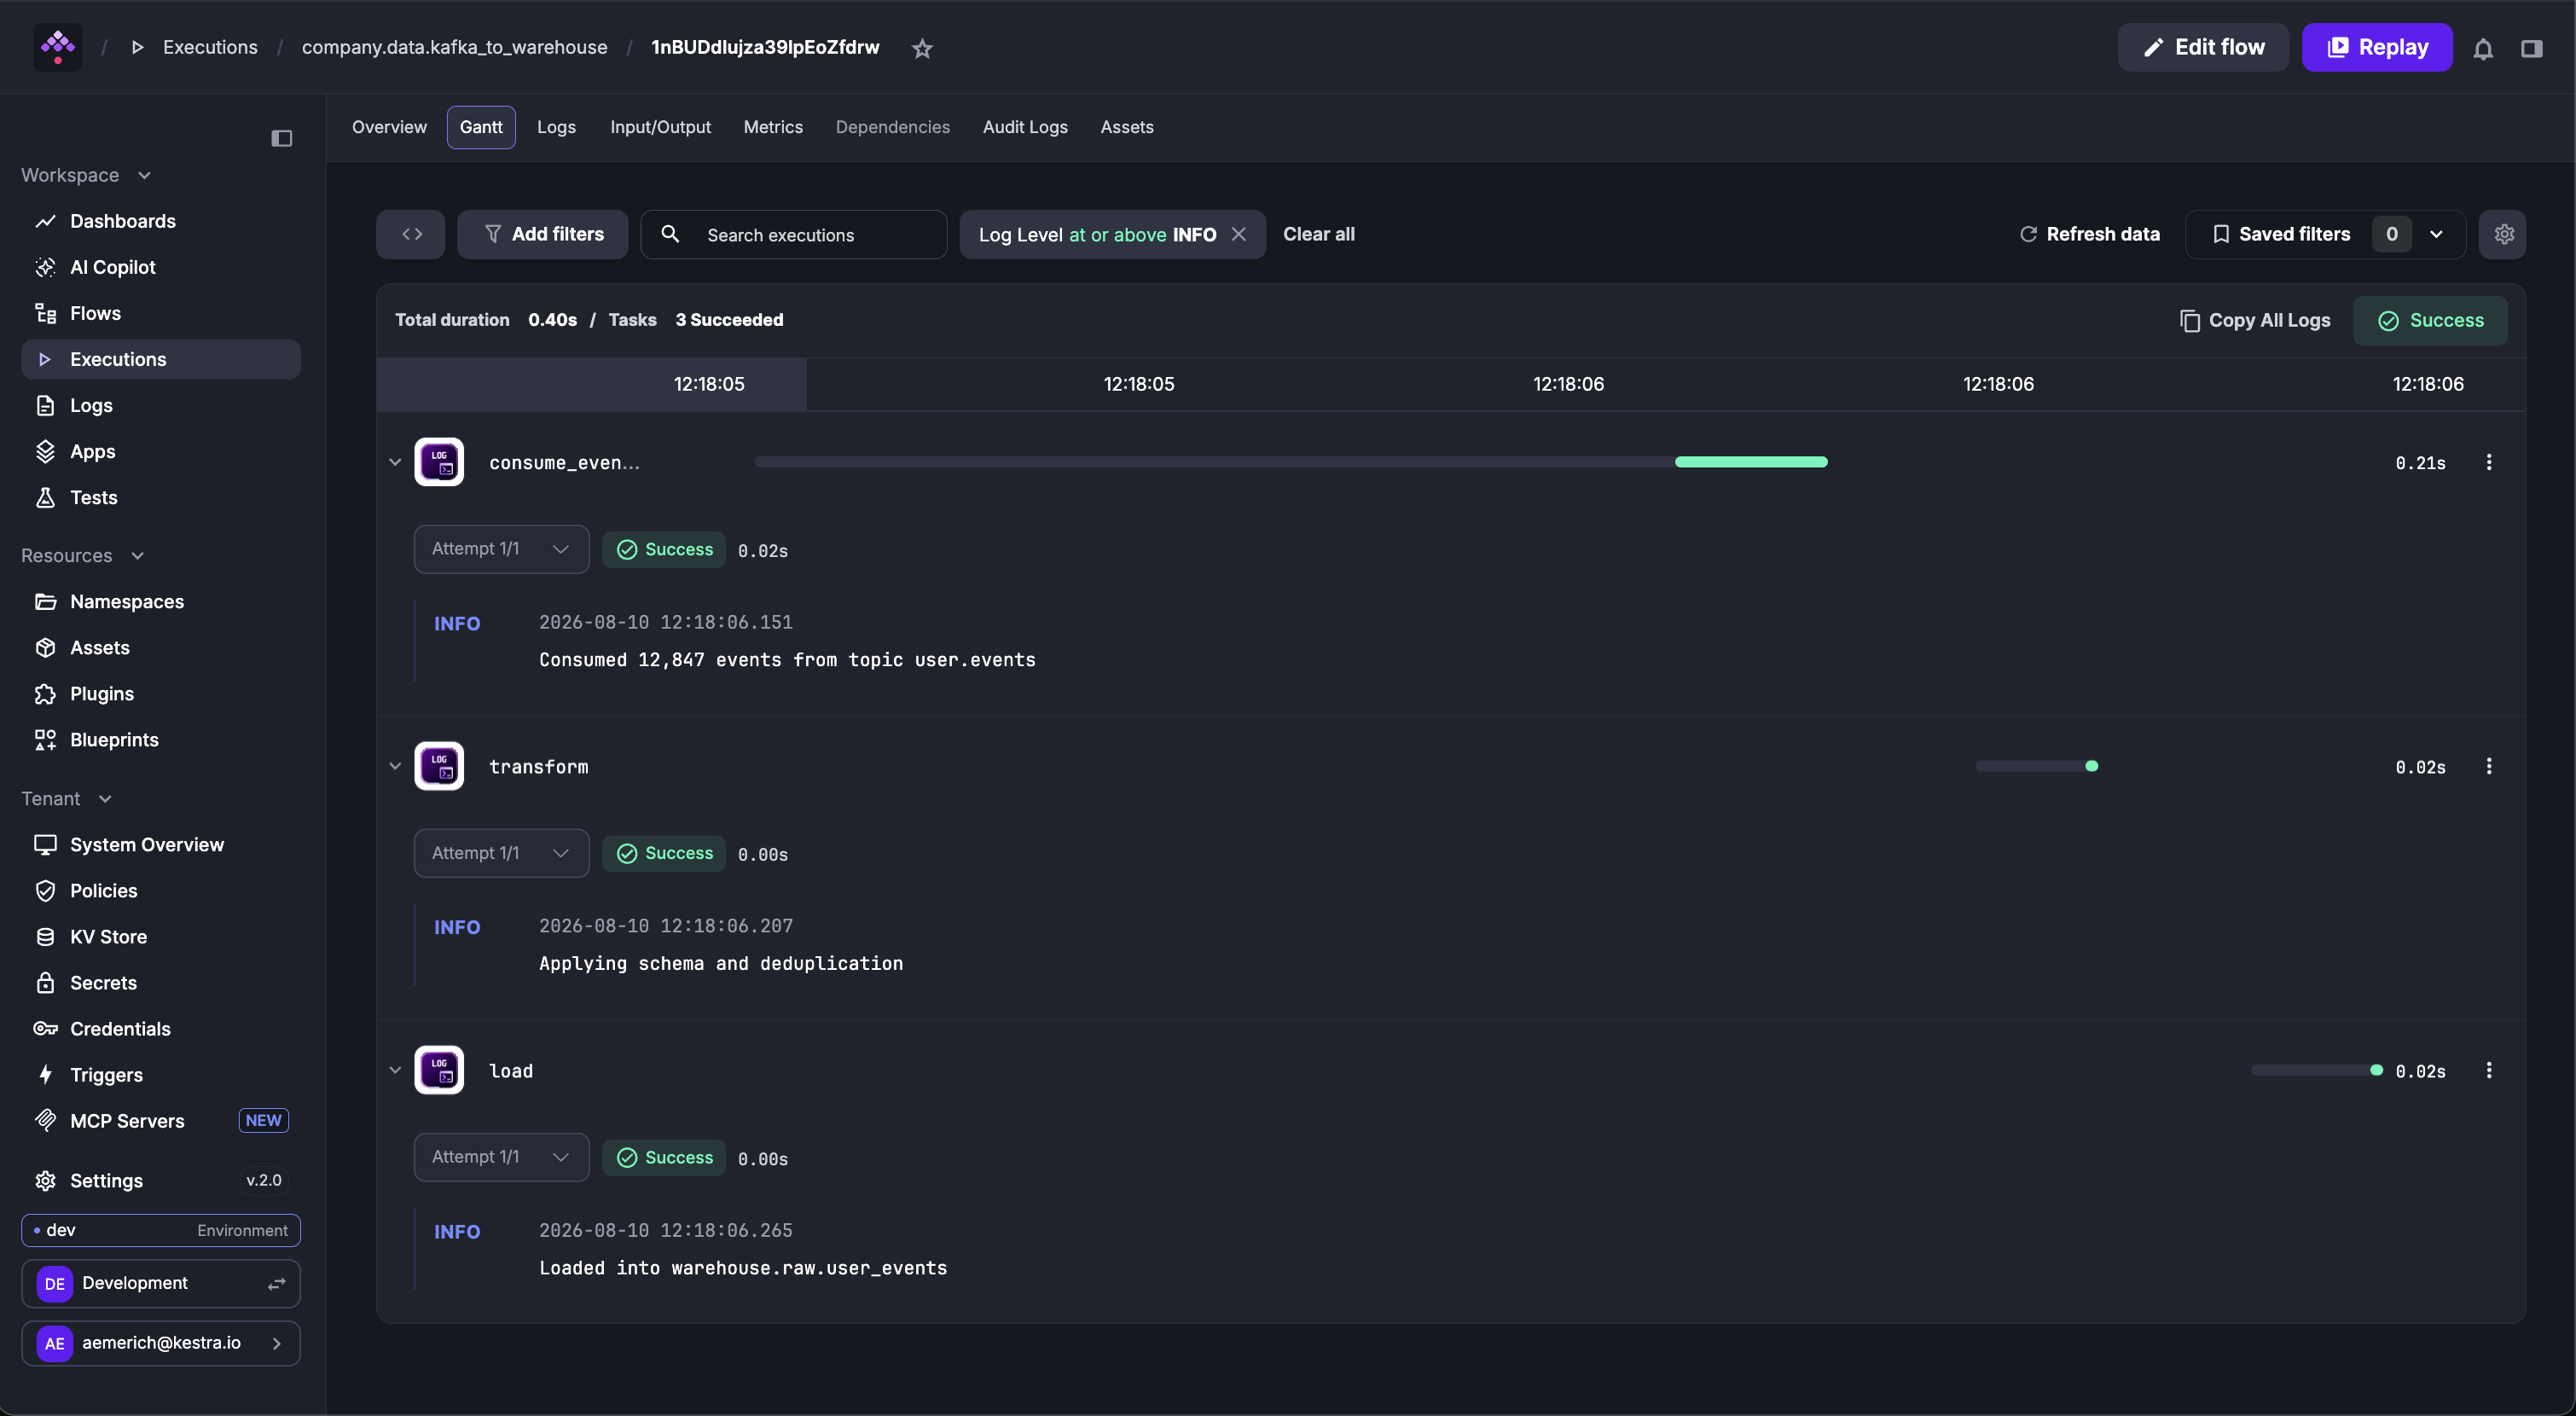
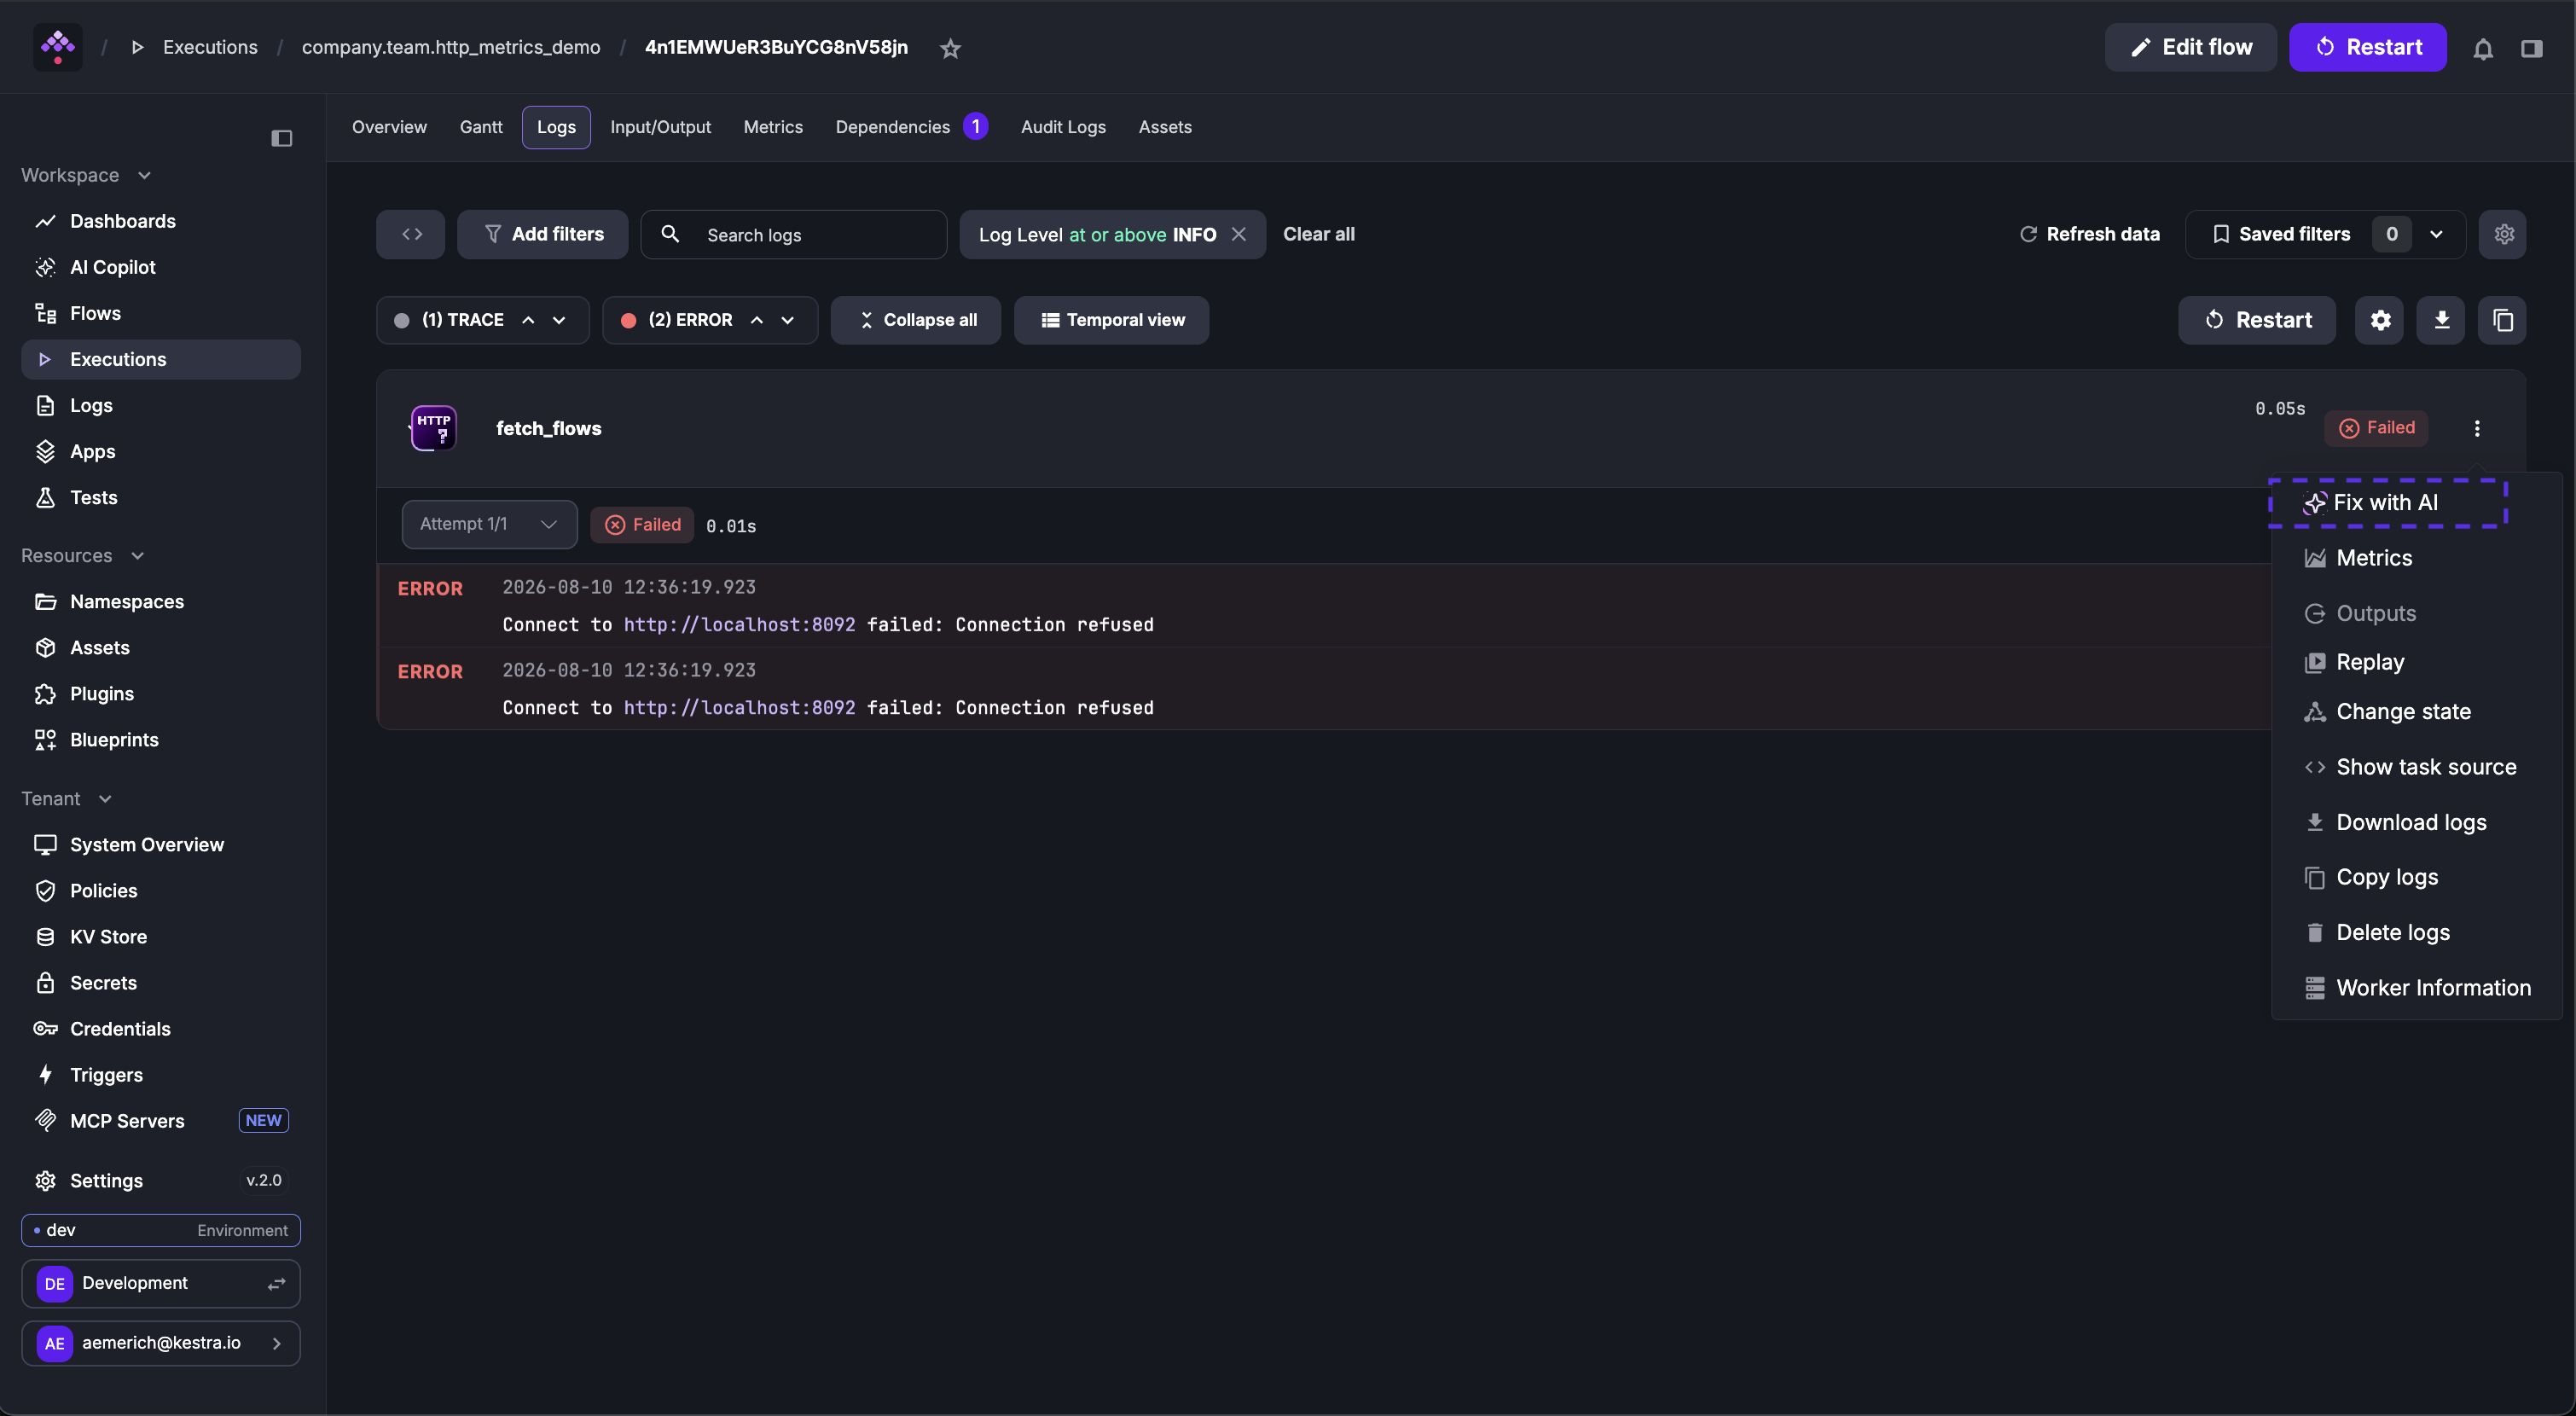
The Gantt view displays all successful and failed tasks in the execution. For failed tasks, use Fix with AI from the task menu to open the flow editor with AI Copilot pre-loaded with the error context.
Logs
The Logs tab gives access to a task’s logs. You can filter by log level, copy logs into your clipboard, or download logs as a file. Logs can be viewed per task in the Default View or temporally based on timestamp in the Temporal View.
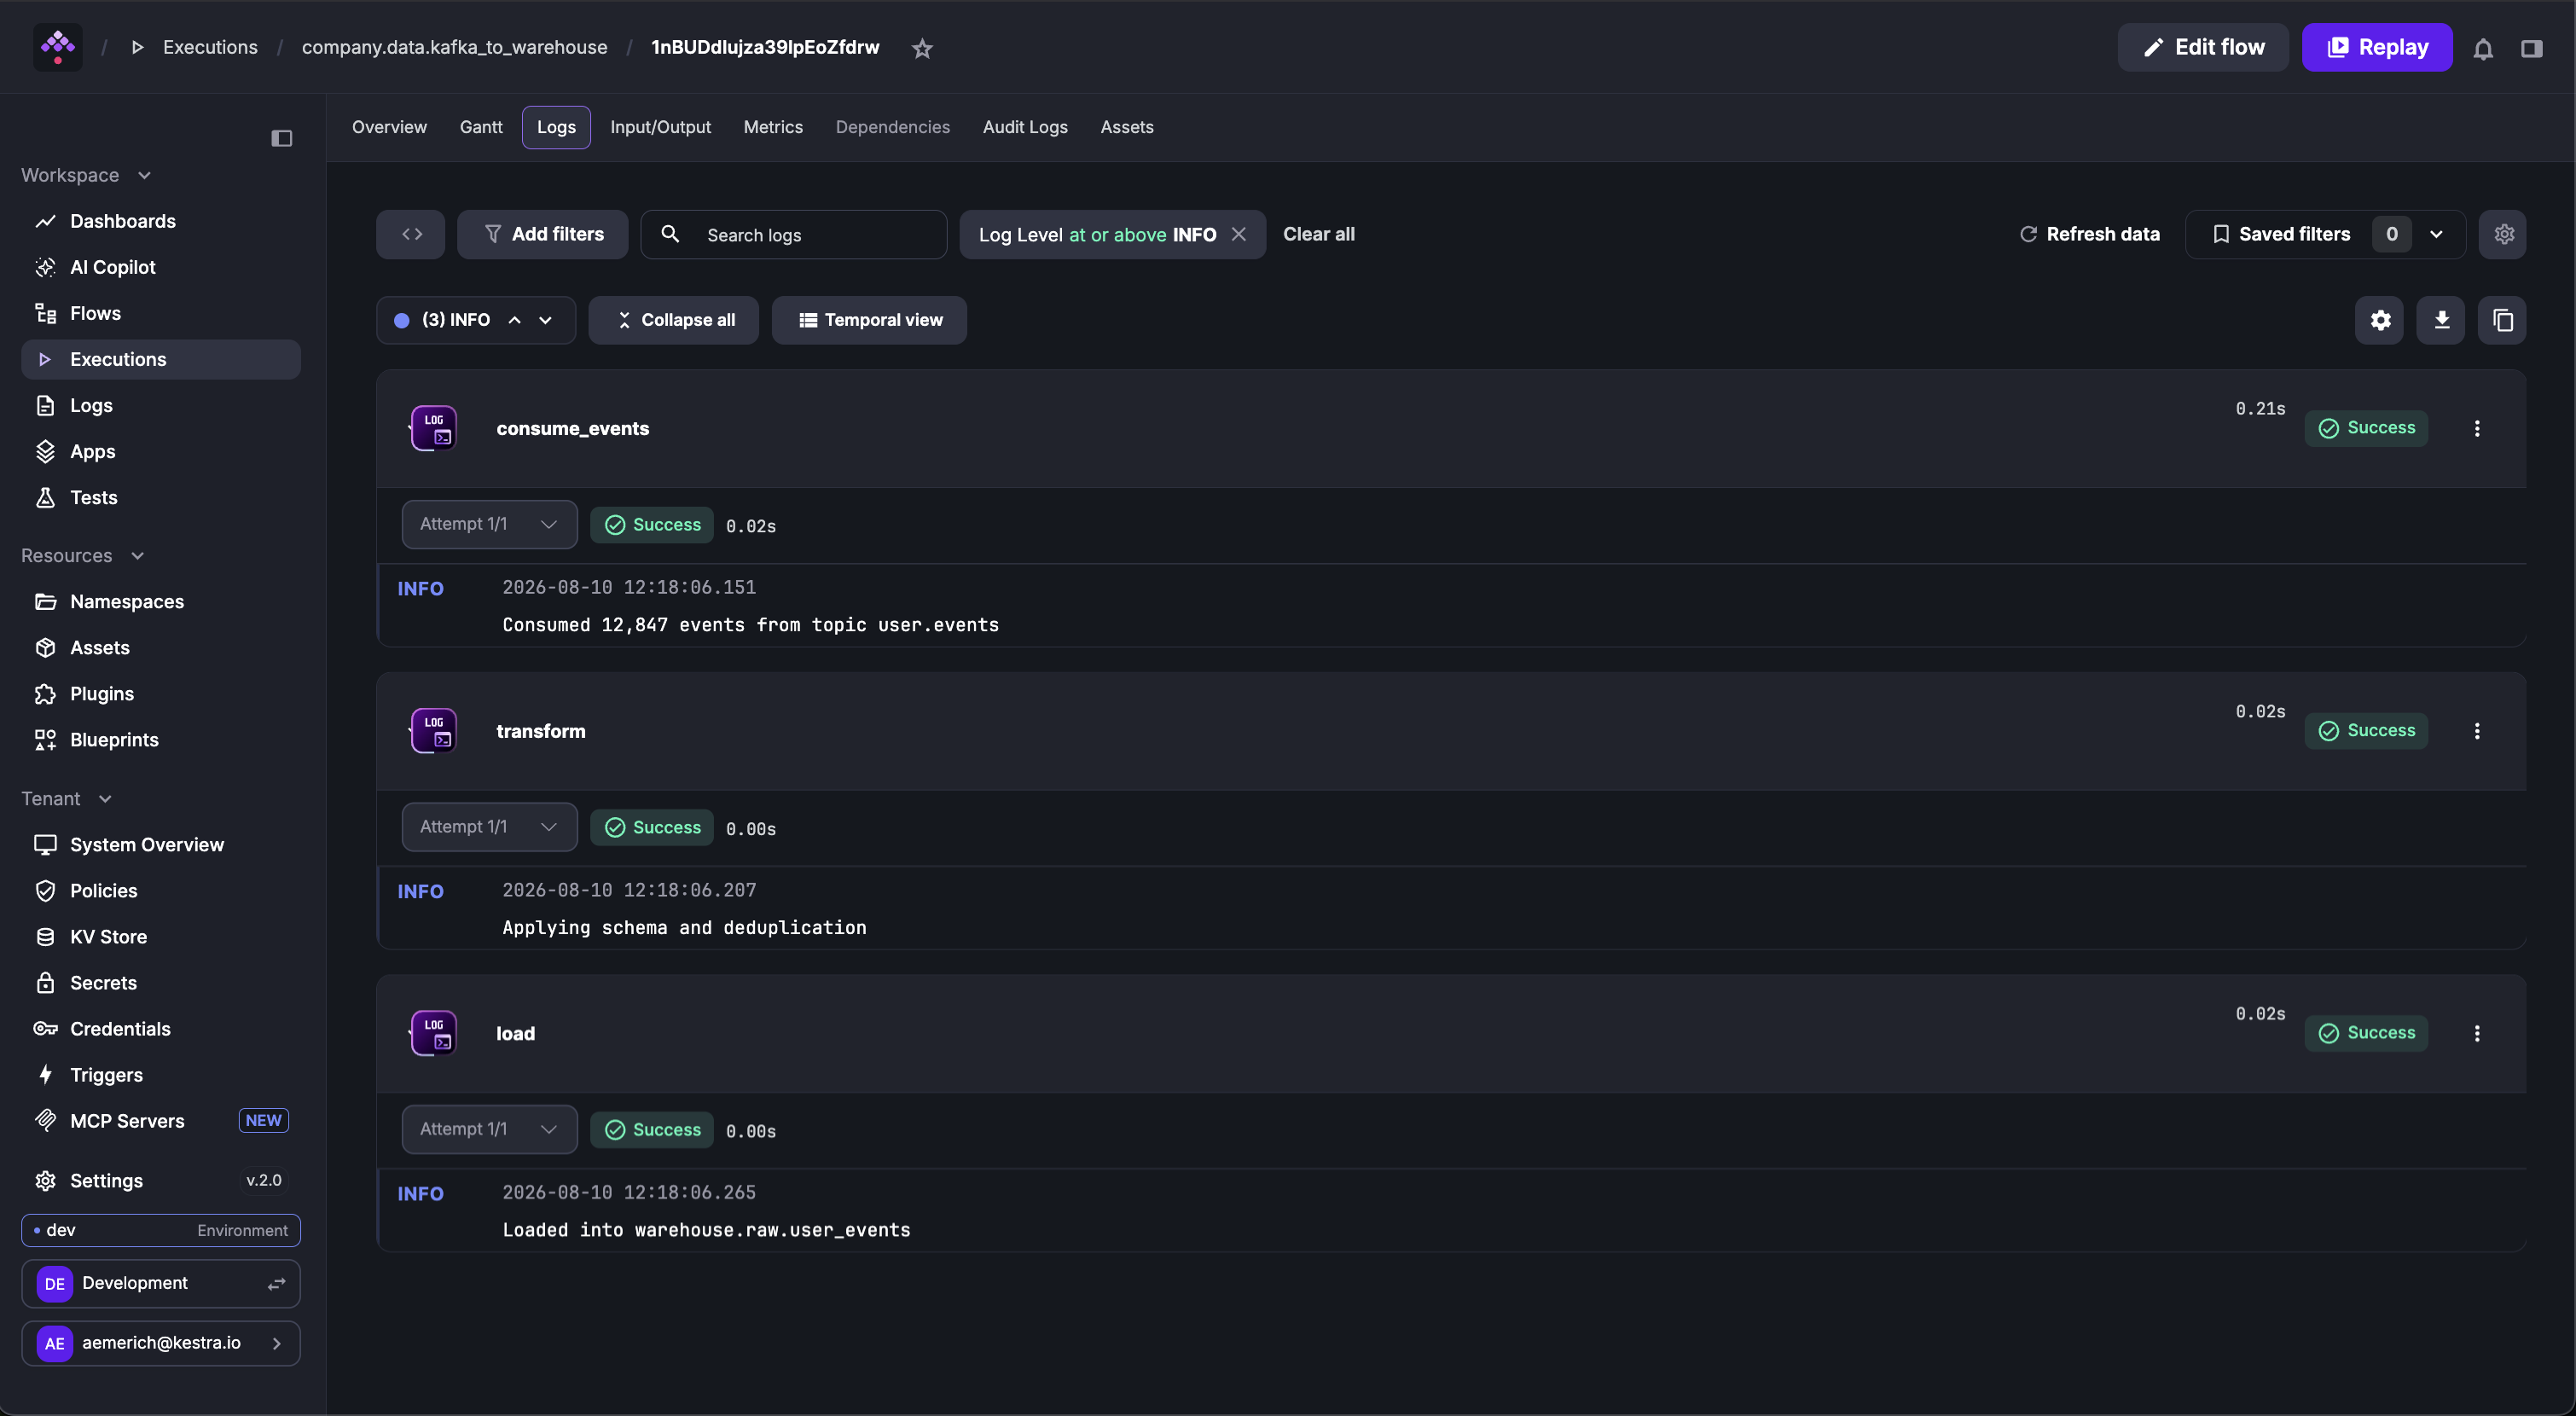
For failed tasks, use Fix with AI from the task menu to open the flow editor with AI Copilot pre-loaded with the error context.
Input/Output
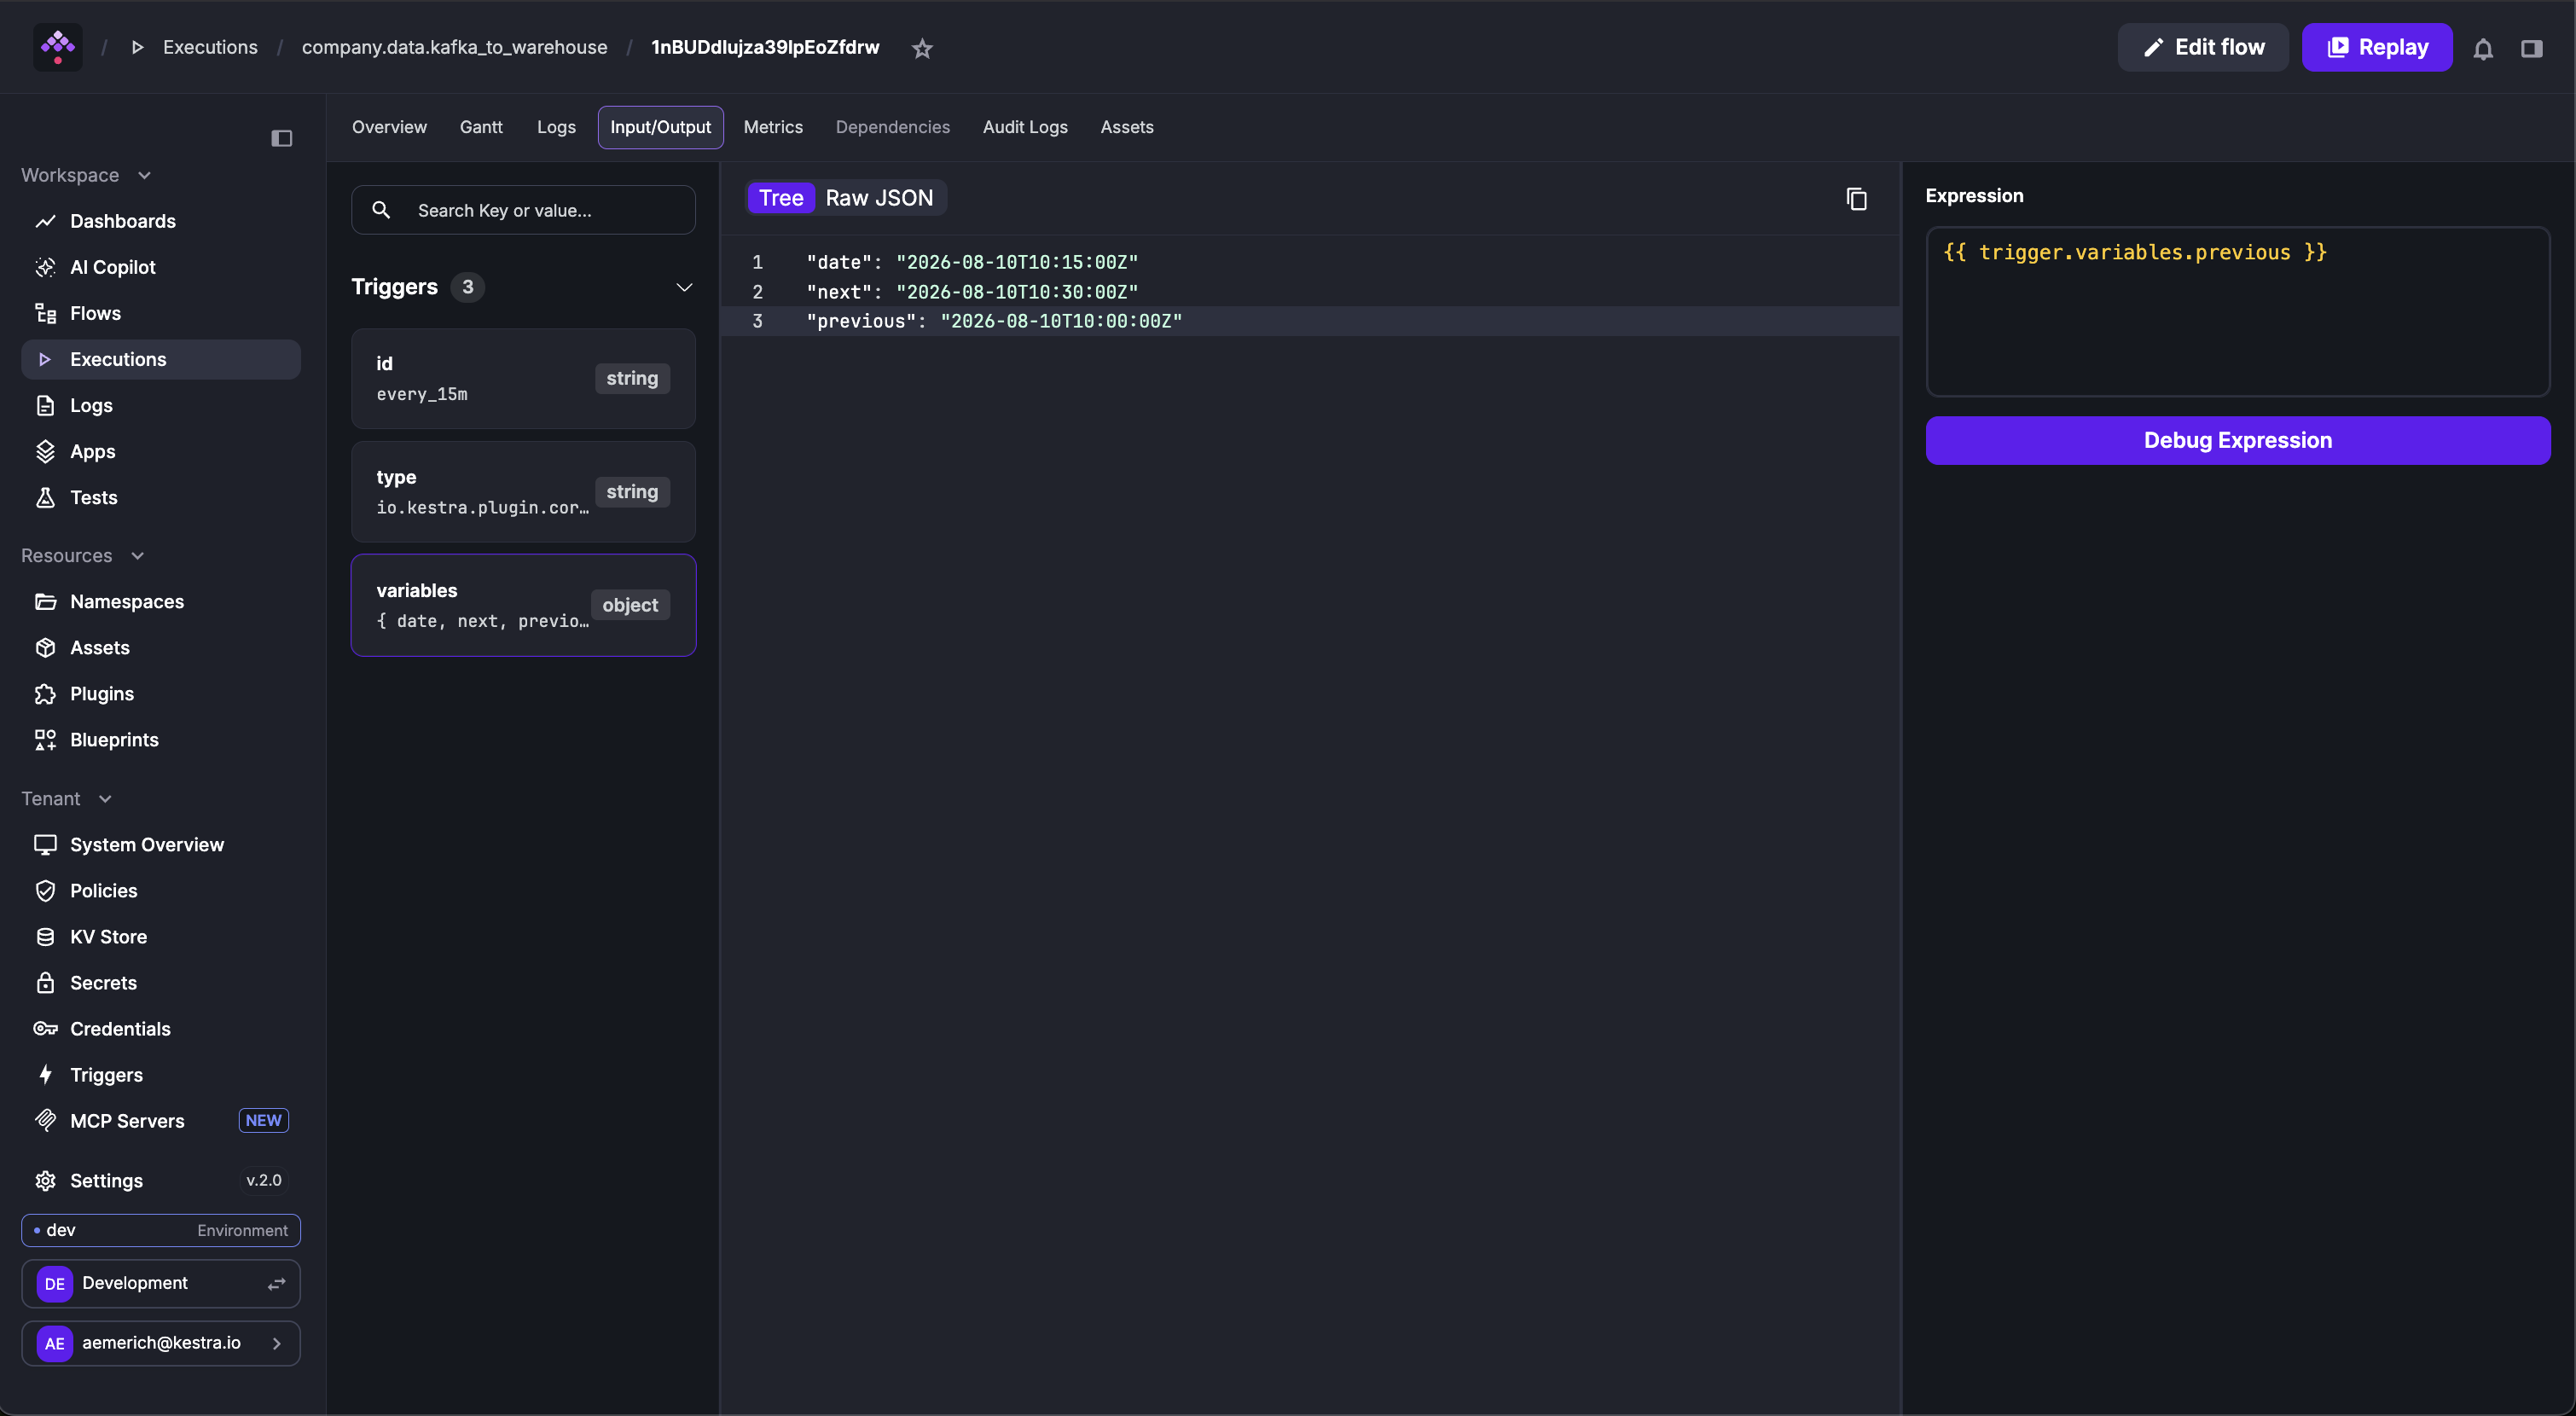
The Input/Output tab shows execution inputs and all task outputs — variables to pass downstream or files to download and inspect. The example below downloads a file generated from a SQL query.
The Debug Expression button lets you evaluate expressions against task outputs to verify they match what you expect. Select a task first to enable it.
Metrics
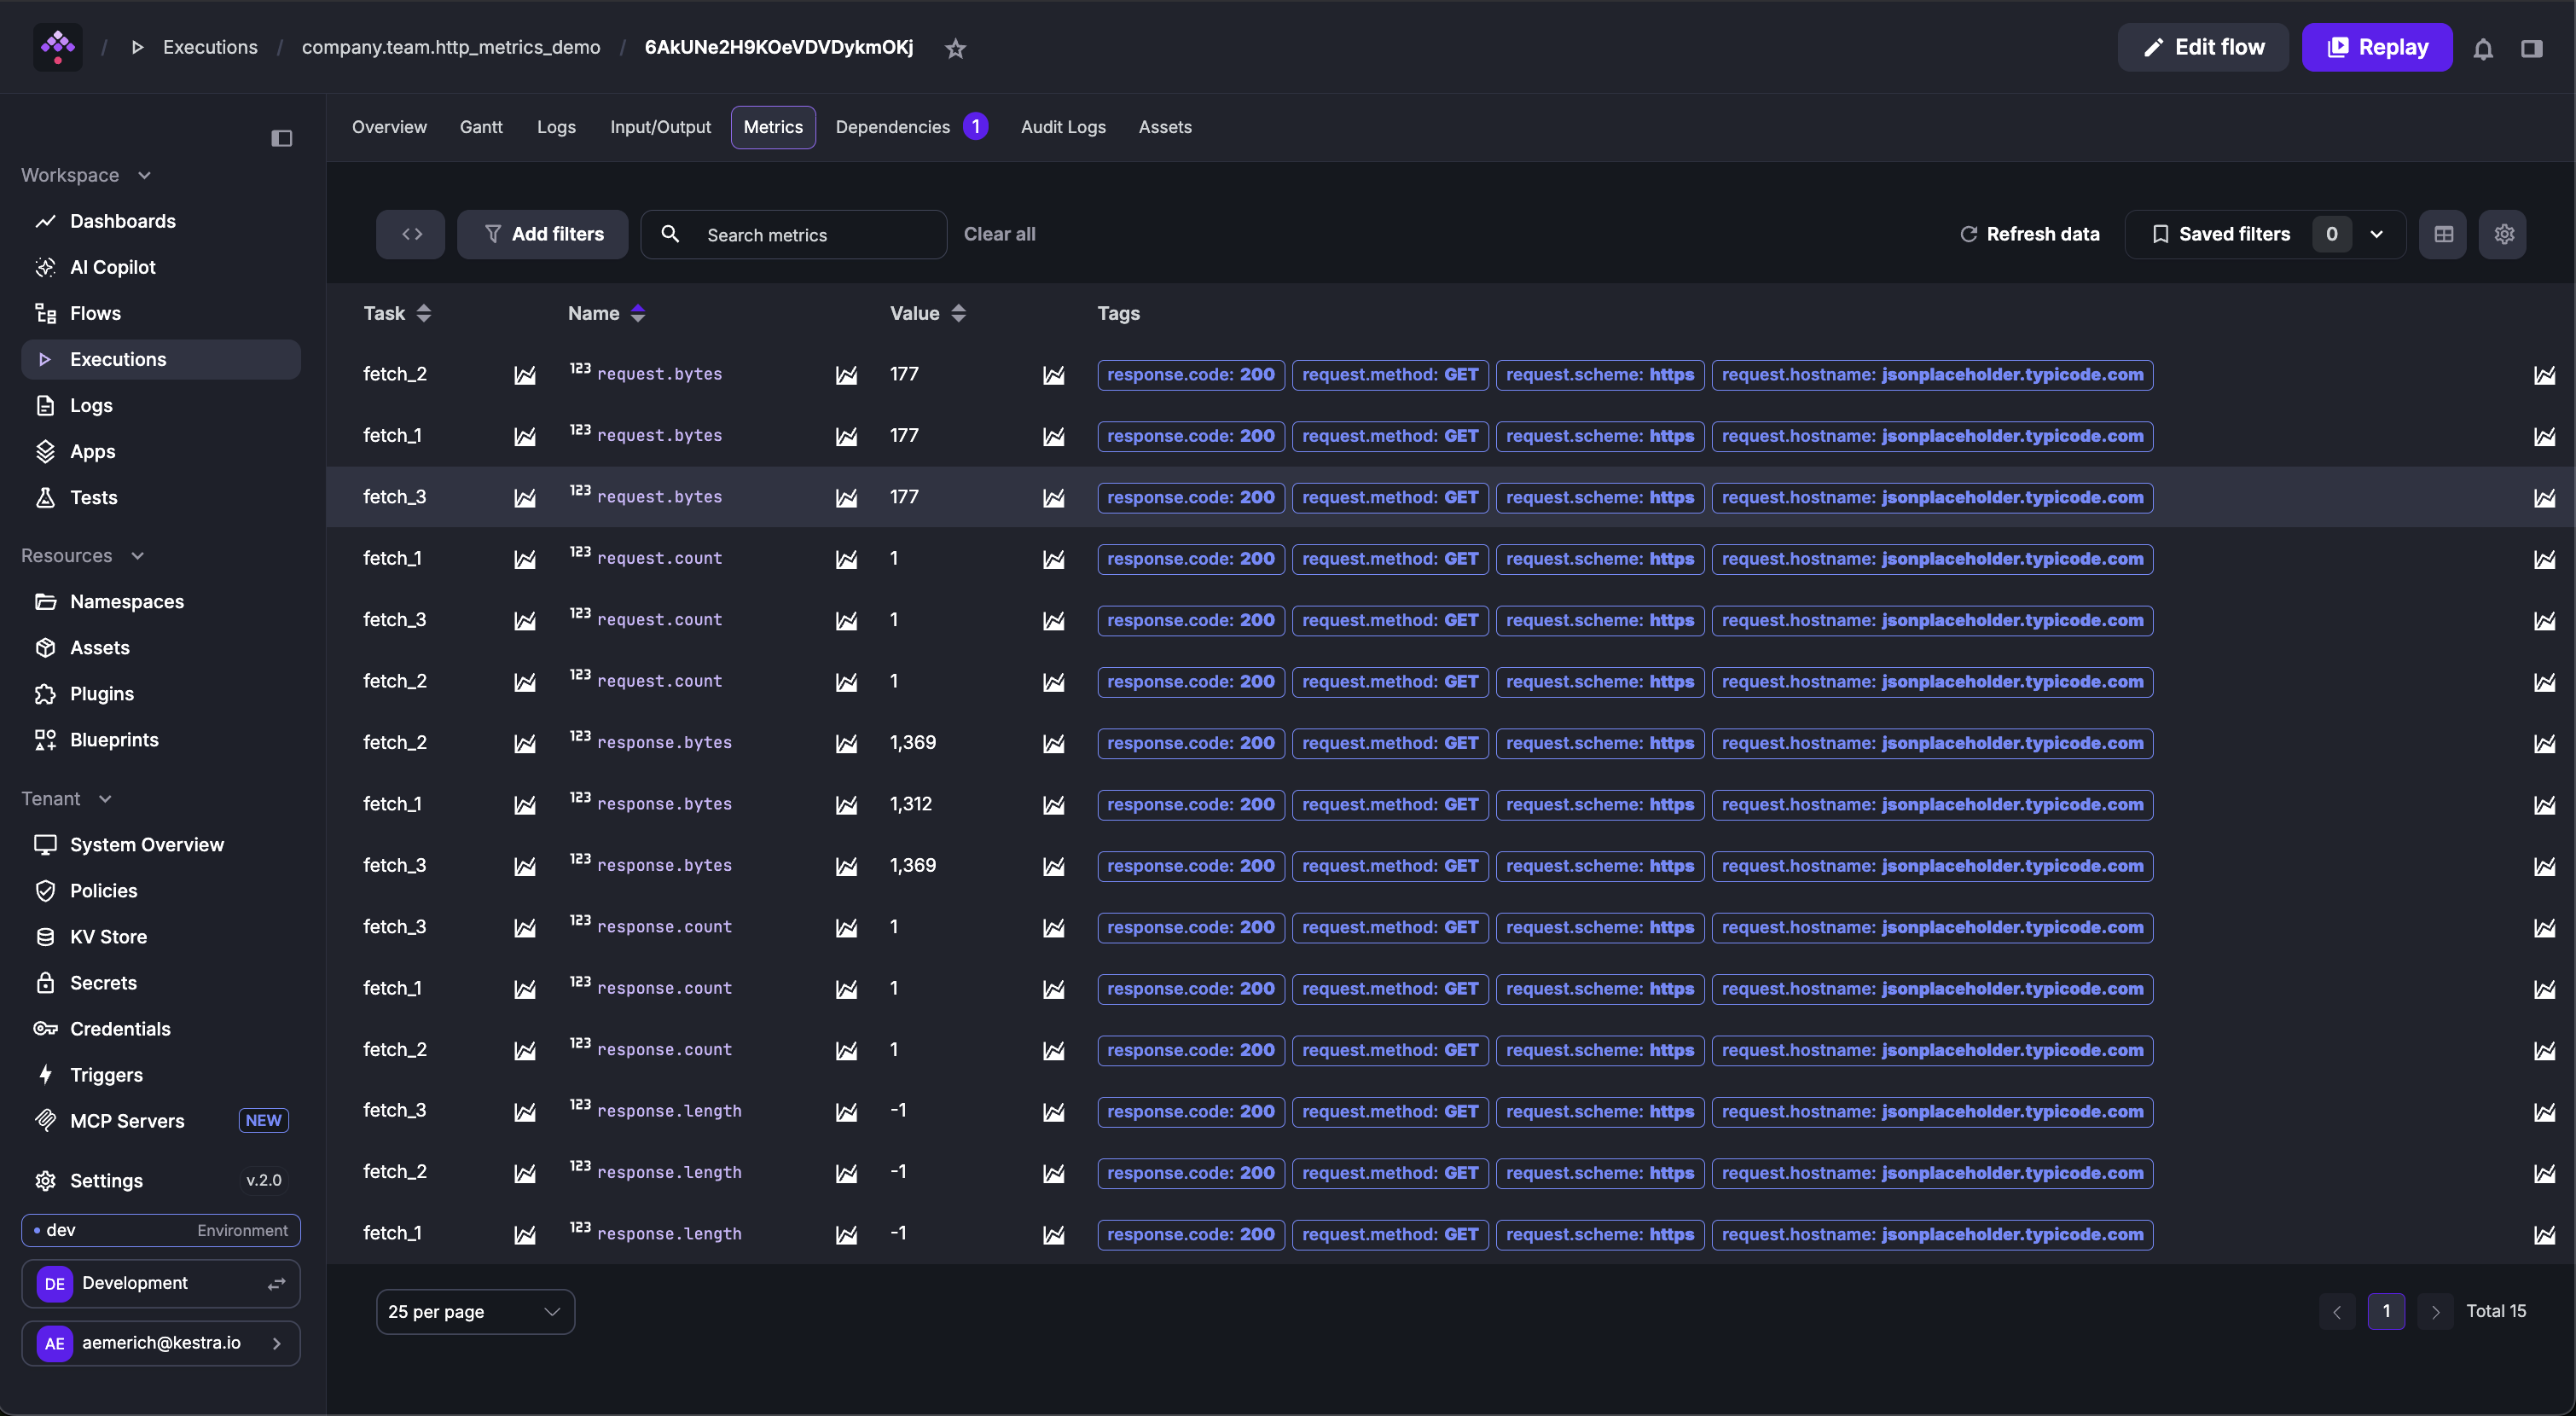
The Metrics tab shows every metric exposed by tasks after execution. For example, an HTTP Request task emits request.bytes, response.bytes, and response.length per request. A BigQuery load task might expose rows inserted and bytes processed. An AI plugin task might show token usage.
Dependencies
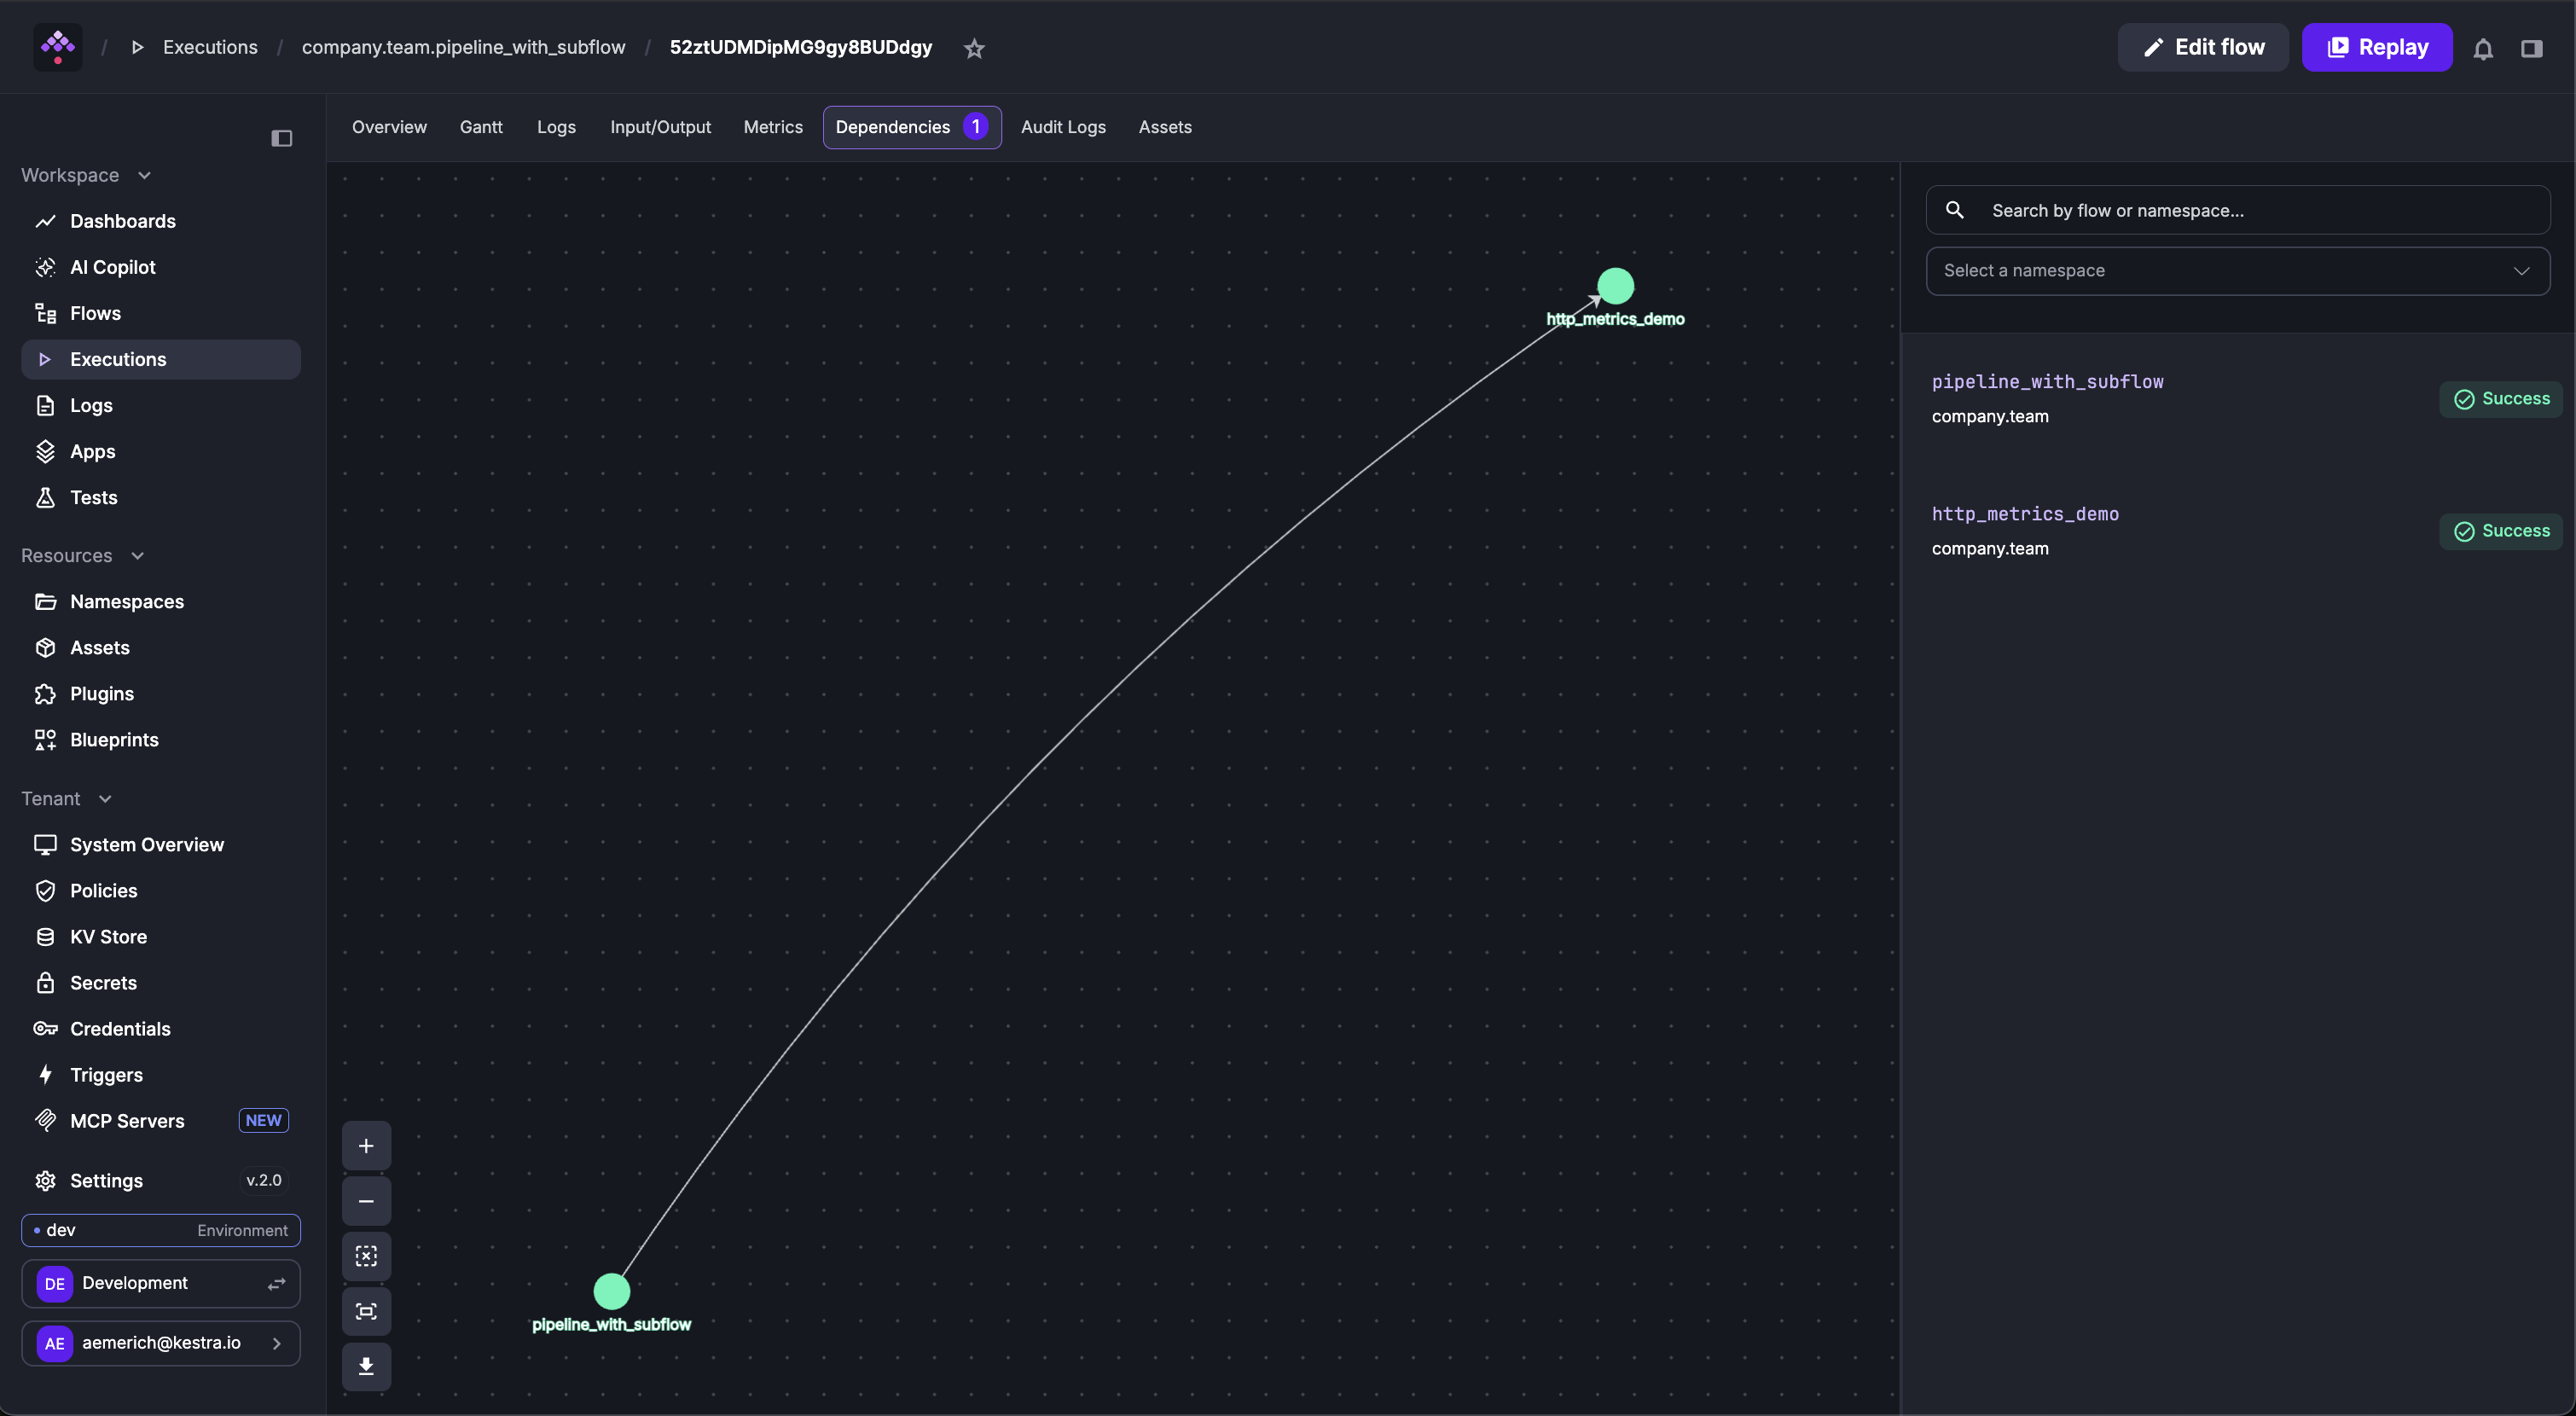
The Dependencies tab shows the relationship between other flows and the selected execution, including extra execution metadata such as state.
Was this page helpful?